Shopify Customer LTV for Operators Who Build to Last
/

Calculating your Shopify customer LTV is the first step toward profitable growth, but most guides get it wrong from the very beginning. They'll give you a simple, clean formula: Average Order Value × Purchase Frequency × Customer Lifespan.
While it’s technically a formula, this one-size-fits-all approach is a trap. For serious operators, it’s not just misleading—it's dangerous.
Table of Contents
The four ways operators calculate LTV (and which is right for what)
Matching the Model to the Mission
LTV Calculation Methods at a Glance
Historical cohort LTV
How to Build a Basic Cohort Analysis
Predictive LTV
From Early Signals to Proactive Decisions
Contribution margin LTV vs revenue LTV
The True Cost of an Order
Two Stores, One LTV, Different Futures
LTV:CAC ratios that actually justify spend
Beyond the 3 to 1 Myth
The Most Important Metric: Payback Period
Realistic benchmarks by category
Realistic Ecommerce CLV Benchmarks
Tools that surface this without spreadsheets
How to Choose Your Analytics Stack
The four ways operators calculate LTV (and which is right for what)
Forget the idea of a single, perfect LTV formula. It doesn't exist.
The right calculation depends entirely on the decision you need to make right now. The LTV you put in a pitch deck to tell a growth story is completely different from the LTV you need to set your daily Meta ad bids.
Thinking there’s only one LTV is like thinking there’s only one type of wrench—you wouldn’t use a massive pipe wrench on a delicate watch. For Shopify operators, your LTV model is a tool. You need a full toolkit to build a resilient business.
Matching the Model to the Mission
The most common mistake I see is operators using a simple revenue-based model for every single decision. It’s an easy trap to fall into. Shopify’s own educational materials give a neat example: a customer spends $50 every six months for four years, resulting in a $400 lifetime value.
You’ll see this everywhere. Analyses like this breakdown from Saras Analytics often use structures like $80 AOV × 3 purchases × 2.5 years = $600 LTV.
This is a great starting point for high-level forecasting. But if you use this number to manage your ad spend, you're setting yourself up for failure. When it comes to acquisition, profit margin is the only thing that matters.
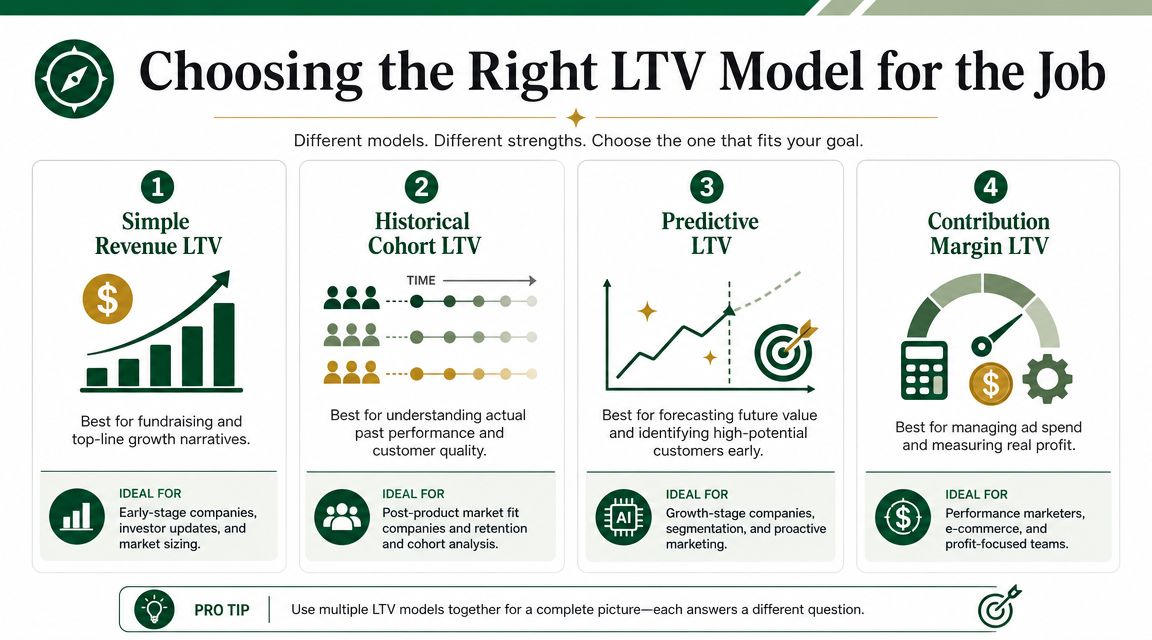
Let’s break down the four primary LTV models operators actually use and, more importantly, when to deploy each one.
Historical Cohort LTV: This is your ground truth for past performance. You use this to analyze how the value of your customer base has changed over time. It tells you what has happened, which is crucial for understanding your business's health.
Predictive LTV: Essential for fast-growing brands that can't afford to wait a year to know what a customer is worth. This model helps you make forward-looking decisions on customer segmentation and where to invest in retention.
Contribution Margin LTV: This is the operator's most important tool, period. It’s the only model you should use to set ad budgets and measure the true profitability of your marketing channels. It accounts for your costs, telling you what you can actually afford to spend.
Simple Revenue LTV: This is your big-picture number. It's best for high-level forecasting, fundraising narratives, and showing investors the top-line growth potential. It’s designed to be the biggest, most optimistic figure.
This framework moves you beyond the simplistic formula that leads so many brands astray. Let's dig into how to build and use each of these models to make sharper, more profitable decisions.
LTV Calculation Methods at a Glance
Choosing the right LTV model is all about matching the tool to the task at hand. This table gives you a quick reference for which calculation to use based on the business decision you're facing.
LTV Method | Best For | Key Consideration |
|---|---|---|
Historical Cohort LTV | Analyzing past performance, trend analysis | Grounded in real data but is a lagging indicator. Not ideal for fast-moving decisions. |
Predictive LTV | Customer segmentation, proactive retention | Uses data science to forecast future value but requires sophisticated modeling. |
Contribution Margin LTV | Setting ad budgets, measuring channel ROI | The most accurate for profitability decisions, but requires precise cost data. |
Simple Revenue LTV | Fundraising, high-level forecasting | Provides the largest, most optimistic number, but ignores profitability. |
Think of these models as different lenses for viewing your customer base. Each one reveals a different truth, and knowing which one to look through at any given moment is what separates good operators from great ones.
Historical cohort LTV
If you want the unvarnished truth about your customer value, you need to look backward. Historical cohort LTV is your business’s rearview mirror—it's not about forecasting or what could happen, but about what actually happened. This is the most honest LTV calculation you can make because it’s grounded in cold, hard data: your customers’ real spending history.
This method works by grouping customers into "cohorts" based on the month they made their first purchase. Then, you track their cumulative spending over their entire lifecycle. It's the definitive way to get a backward-looking, but incredibly accurate, picture of the value your past customers have delivered.
How to Build a Basic Cohort Analysis
You don't need a fancy tool to get started. You can build a simple version yourself with a Shopify order export and a spreadsheet.
Export Your Orders: Pull your complete order history from the Shopify admin.
Identify the First Purchase: For every customer, pinpoint the date of their very first order. This is what assigns them to a specific cohort, like "January 2026 Cohort."
Track Cumulative Spend: Month by month, sum the total spending for each cohort. You’ll see what the January cohort spent in Month 1, Month 2, Month 3, and so on.
This simple analysis tells a powerful story. Maybe you notice your May cohort is way more valuable after six months than your February one. What happened in May? A new marketing campaign? A killer product launch? This is how you start to understand the quality of customers you're acquiring. Historical cohorts give you the undeniable baseline for every other Shopify customer LTV calculation.
Of course, wrestling with spreadsheets gets old fast. The process is tedious and riddled with potential for human error. This is where modern analytics tools are a lifesaver, automating the heavy lifting and saving you from "spreadsheet hell."
Here’s a great example from analytics provider Tresl showing a typical cohort analysis dashboard.
Dashboards like this do all the grouping and tracking for you. They visualize exactly how much revenue each new customer group generates over time, which is essential for truly understanding your retention and repeat purchase behavior.
Predictive LTV
If historical LTV is your rearview mirror, looking at what’s already happened, then predictive LTV is your GPS. It uses the data you have right now to map out where a customer is likely to go in the future.
This is a forward-looking model that uses a customer's earliest purchasing behaviors to forecast their total future value. For new brands without years of data, or for any operator who needs to make decisions before the full picture emerges, this approach is invaluable.
Predictive models can range from simple projections to complex machine learning algorithms. A basic model might look at a customer's first 30 days—what they bought, how much they spent, if they used a discount—and compare that to historical cohorts to forecast their likely 12-month value. This lets you spot high-potential customers almost immediately.
From Early Signals to Proactive Decisions
The real magic of predictive LTV is its speed. You don't have to wait a year to find out if a customer cohort was valuable. Instead, you can use these early indicators to make smarter, faster decisions on where to invest your marketing dollars.
Identify VIPs Early: Spot customers who show signs of high future value and roll out the red carpet with exclusive offers or personalized outreach.
Optimize Ad Spend: If a new campaign is bringing in customers with a low predicted LTV, you can pull the plug quickly instead of waiting months to realize they don’t stick around.
Proactive Churn Prevention: These models can flag customers who are at high risk of churning, giving you a chance to step in with a targeted retention campaign before they're gone for good.
Predictive analytics isn't just about guessing the future; it's about actively shaping it. When you know which early behaviors correlate with long-term value, you can build campaigns and experiences that encourage those exact behaviors from day one. For a deeper dive, check out how to transform data into intelligent campaigns.
Modern analytics tools are making these sophisticated models more accessible than ever. Here’s a look at a dashboard from RelevantBits, which uses predictive analytics to give merchants powerful insights into future customer behavior.
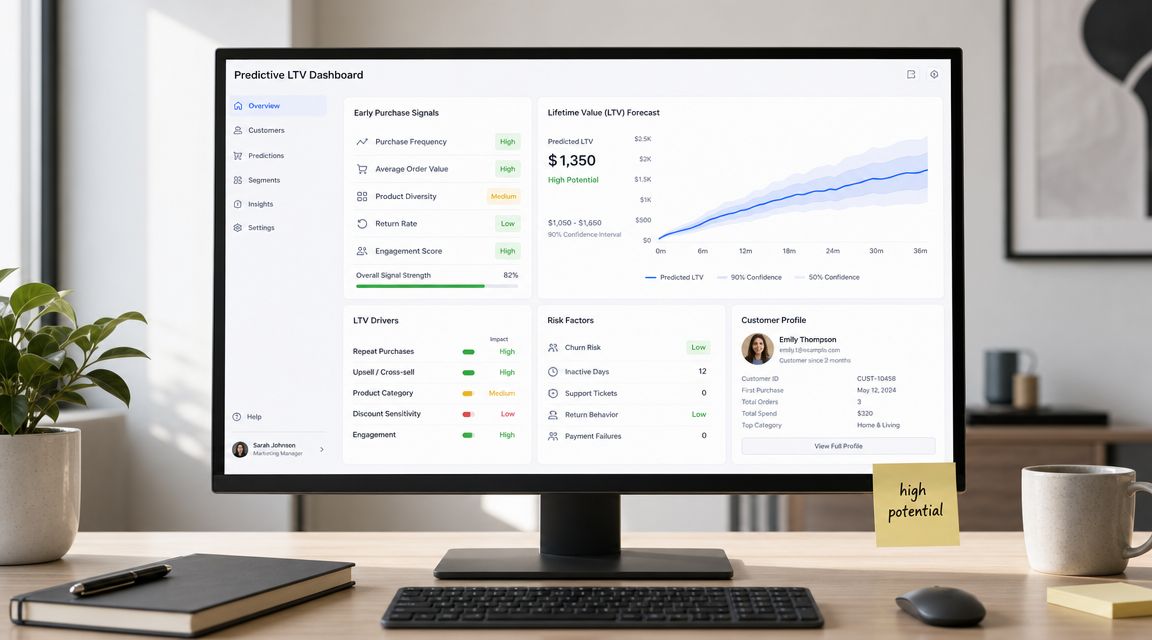
This kind of analysis allows you to shift from being reactive to proactive. Instead of just measuring past results, you start influencing future outcomes and optimizing your marketing spend in near real-time. That’s a serious operational advantage.
Contribution margin LTV vs revenue LTV
Let's get straight to the point. This is the single most important concept you need to grasp for profitable scaling. So many operators get fixated on Revenue LTV, but it's a vanity metric.
Contribution Margin LTV is the sanity metric. It’s the number that actually keeps your business alive and tells you whether your growth is making you real money.
In simple terms, Contribution Margin LTV is what's left after you subtract all the variable costs from your customer revenue. This isn't just your cost of goods; it's every single cost that changes with each order you ship.
The True Cost of an Order
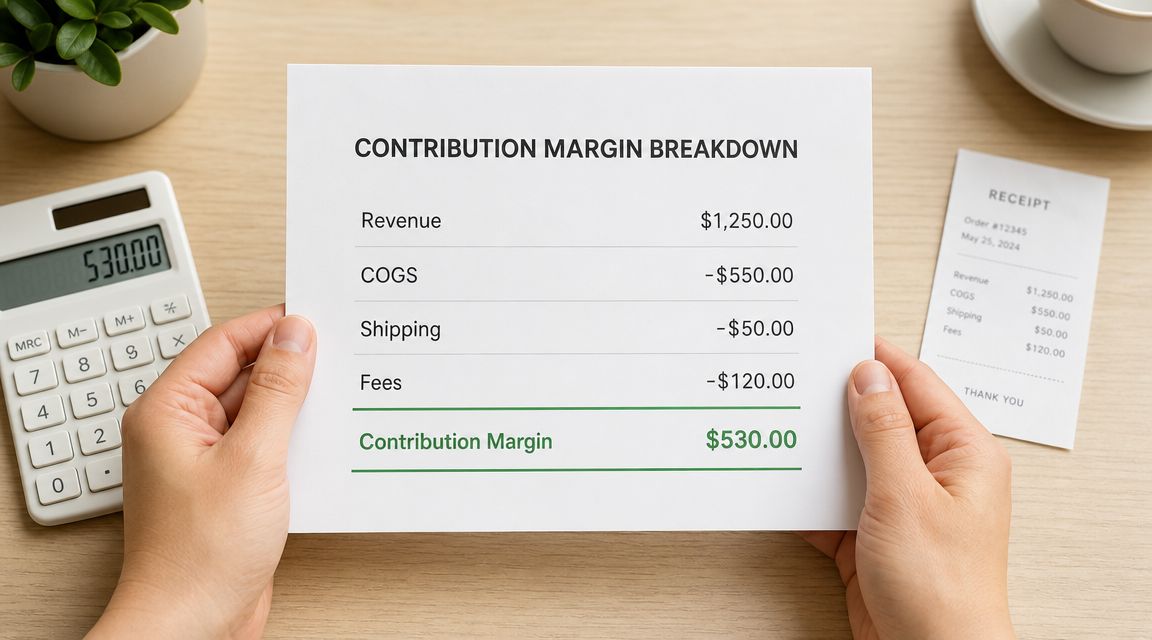
To get this right, you have to be brutally honest about every variable expense tied to a sale. The formula for your contribution margin on any given order looks like this:
Contribution Margin = Total Revenue - (COGS + Payment Processing Fees + Shipping Costs + Fulfillment Costs + Discounts)
This number is the actual profit you bank from a customer on that order. It's the only money left to cover your fixed costs—things like salaries, rent, and software—and, critically, your Customer Acquisition Cost (CAC).
Setting your ad budgets based on Revenue LTV is a fast track to unprofitable growth. It creates a dangerous illusion where you're busy acquiring customers who are secretly losing you money on every single purchase.
Two Stores, One LTV, Different Futures
Picture two Shopify stores. On the surface, they look identical. Both have a 12-month Revenue LTV of $300 per customer.
Store A sells lightweight, high-margin products. Their contribution margin is a healthy 70%. This gives them a Contribution Margin LTV of $210.
Store B sells heavy, low-margin goods with expensive shipping. Their contribution margin is a razor-thin 25%. Their Contribution Margin LTV is just $75.
Store A can comfortably spend up to $70 to acquire a customer and still maintain a solid 3:1 LTV:CAC ratio. But Store B, chasing that same flashy $300 revenue figure, might set their CAC target at $100. They'd be unknowingly losing $25 on every new customer they bring in.
This distinction is everything when it comes to building a sustainable ecommerce business. And it goes beyond just calculating LTV. Strategic moves like smart product pricing directly impact your margins and, by extension, your lifetime value. If you need to get tactical on this, there's a great no-fluff guide to product pricing that offers some actionable frameworks.
Ultimately, knowing your Contribution Margin LTV means you know exactly how much cash you have to play with. It forces discipline and ensures every dollar you pump into marketing has a clear path to a profitable return.
LTV:CAC ratios that actually justify spend
The LTV to CAC ratio is probably the single most important metric for judging the health of your marketing and the long-term viability of your business. It cuts through the noise and asks a straightforward question: for every dollar you spend to bring a new customer in the door, how much profit will they generate for you over their entire relationship with your brand?
You've almost certainly heard of the 3:1 benchmark—the idea that you should be making back three dollars in lifetime value for every dollar you spend on customer acquisition. It's a decent rule of thumb, but treating it as gospel is a huge mistake. A "good" ratio is completely contextual. It depends entirely on your business model, your margins, and most importantly, your cash flow.
Beyond the 3 to 1 Myth
The ideal LTV to CAC ratio isn't a fixed target. The reality on the ground is what matters.
A high-margin subscription box company can thrive on a lower ratio, maybe even 2:1. Why? Because their cash flow is predictable and their payback period is quick. That recurring revenue stream gives them a ton of stability.
On the other hand, a brand selling seasonal or big-ticket items needs a much higher ratio, think 4:1 or 5:1. The risk is just greater. There's no guarantee that a customer who buys a Christmas-themed item will come back next year.
Then you have the venture-backed brands in a high-growth, market-share-grabbing phase. They might deliberately run at a 1:1 or even negative ratio for a while. It's a high-stakes bet on future monetization that only works if you have very, very deep pockets.
The consensus from operators publishing in places like Lenny's Newsletter and public analyses from platforms like Triple Whale is clear: nuance is everything. A single number just doesn't tell the whole story. As noted by experts at Yotpo, getting your hands dirty with your app stack is a simple way to not only find new tools but also help shape them to better tackle challenges like improving customer value.
The Most Important Metric: Payback Period
For most bootstrapped or cash-conscious brands, the payback period is often a more urgent and practical metric than the LTV:CAC ratio itself.
Payback Period is simply the number of months it takes for a customer's accumulated profit to cover their initial acquisition cost.
Let’s say your Customer Acquisition Cost (CAC) is $60, and that customer generates $10 in contribution margin for you each month. Your payback period is six months. Simple as that. This is the number that governs your cash flow.
A 12-month payback period might look perfectly fine on an investor's spreadsheet, but for a brand that needs to pay its bills next month, waiting a full year just to break even on a customer is a potential death sentence.
A short payback period—ideally under 6 months for most DTC brands—is what lets you pour cash back into your acquisition engine and fuel a sustainable growth loop. It's the metric that keeps the lights on while you wait for that bigger, long-term LTV to materialize. Understanding how to shrink this window with smart tactics, like those we explore in our guide to the best SMS marketing apps for Shopify, can be an absolute game-changer.
Realistic benchmarks by category
Knowing your Shopify customer LTV is a great first step, but the number is pretty meaningless on its own. So you have a $150 12-month LTV—is that good? Bad? The honest answer is: it depends. Without context, you’re just staring at a number.
This is where benchmarking comes in. It provides that crucial context, helping you set realistic goals and figure out if there’s a problem you need to fix. For example, a subscription coffee brand and a luxury furniture store operate in completely different universes. One succeeds with small, frequent orders, while the other depends on massive, infrequent purchases. Your entire growth strategy has to align with the reality of your industry.
Realistic Ecommerce CLV Benchmarks
The fastest way to see where you stand is to compare your metrics against reliable industry data. I’ve pulled together some numbers from Shopify Plus reports and other industry analyses to give you a solid idea of what “good” looks like across different verticals.
Just remember, these are averages. Your results will naturally vary based on your specific business model, margins, and customer base. The point isn’t to hit these numbers exactly but to use them as a guide.
Ecommerce CLV and LTV:CAC Benchmarks by Industry
This table summarizes typical LTV metrics across common ecommerce verticals. Use it to get a feel for whether your performance is in the right ballpark or if your expectations are out of sync with your market.
Industry Category | Typical 12-Month Revenue LTV | Target LTV:CAC Ratio | Average Payback Period (Months) |
|---|---|---|---|
Apparel & Fashion | $120 - $250 | 3:1 to 4:1 | 6 - 9 |
Consumables (CPG) | $80 - $180 | 2:1 to 3:1 | 3 - 6 |
Home Goods | $200 - $450 | 4:1 to 5:1 | 9 - 12+ |
Beauty & Cosmetics | $90 - $200 | 3:1 to 4:1 | 4 - 7 |
Subscription | Varies widely by AOV | 2.5:1 to 3.5:1 | 1 - 4 |
If your numbers are way off these benchmarks, it’s a clear sign that you need to do some digging. Don’t panic—a low LTV isn't a failure. Think of it as a diagnostic tool pointing you toward a problem in your pricing, product, marketing, or customer experience.
One final thought: these benchmarks are often based on revenue LTV. As we’ve discussed, contribution margin LTV is what truly drives profitability. A high revenue LTV is great, but if your payback period is so long that it kills your cash flow, you’re solving the wrong problem.
Digging into related metrics is key. For more on this, check out our guide on how to improve your average order value in ecommerce.
Tools that surface this without spreadsheets
As a store operator, your time is your most valuable asset. Wasting it wrestling with spreadsheets to calculate LTV is a recipe for burnout, not growth. The Shopify ecosystem is packed with powerful tools designed to automate this analysis, surfacing insights that are nearly impossible to find manually.
This isn't about grabbing the first app you see. It's about finding the right one for your brand's specific stage and goals. The objective is to gain a real competitive edge by spending less time crunching numbers and more time making profit-driving decisions.
How to Choose Your Analytics Stack
The sheer number of analytics apps on Shopify can feel overwhelming. Don’t worry—they generally fall into a few key categories, each with its own strengths.
Here's a quick look at the kind of reporting and analytics tools you’ll find on the Shopify App Store.
This landscape is a mix of all-in-one platforms and highly specialized tools. Knowing the difference is key to making a smart choice.
Historical & Cohort Analysis: Apps like Tresl are fantastic for deep-diving into your store's history. They automate the painful work of cohort analysis, showing you exactly how much value specific groups of past customers have brought in over time.
Predictive Modeling: For newer brands or anyone needing to make faster decisions on ad spend, predictive tools are a game-changer. Apps such as RelevantBits use your existing data to forecast future LTV, taking much of the guesswork out of your growth strategy.
All-in-One Dashboards: These platforms act as a single source of truth for your business. They pull data from all your different sources to visualize everything from your LTV:CAC ratio to your net profit margins in one place.
Of course, analytics are only half the battle. To build lasting relationships and actually improve LTV, you need strong marketing automation. If you're looking to level up here, you can find some great primers in Stamina's automation resources.
And if you want to cut through the noise and get a more granular comparison, check out our detailed guide on the best Shopify analytics apps.
The best operators don't just use tools—they influence them. They know their hands-on experience is incredibly valuable to the founders building the apps they rely on every day.
App Store Research is the network where Shopify's top operators get paid to talk directly to the app founders building the tools they use every day. The value is access, influence over roadmaps, and early visibility into what's being built—the $150–$250/hr is a byproduct of that access.
If you're an operator with this kind of valuable experience, you can apply to participate.

Author
Jonathan Kennedy
Jonathan Kennedy is the founder of app store research and shopexperts, platforms that connect operators, founders, and experts across the Shopify ecosystem to drive better decisions, product development, and growth.


