Average Order Value Ecommerce: A Shopify Operator's Guide
/
Most advice on average order value ecommerce starts with the wrong question.
It asks whether a store's AOV is “good” compared with the market. That sounds useful, but it usually sends operators toward vanity benchmarking. A beauty brand with replenishment behavior, a furniture store with high-ticket one-off purchases, and a luxury label shouldn't be chasing the same number.
AOV still matters. It's one of the cleanest ways to improve revenue without buying more traffic. But the useful version of AOV analysis isn't a single average. It's category context, growth-stage context, and then a much harder look at the distribution inside a store's own customer base.
Table of Contents
Your Starting Point AOV Calculation and Data Methodology
AOV starts with one formula
What this guide uses and what it ignores
Ecommerce AOV Benchmarks by Category
A quick benchmark table
How AOV Changes by Store GMV Stage
Why Category Benchmarks Mislead and What to Use Instead
Averages hide the operating model
A better benchmark hierarchy
Analyzing AOV Distribution Within Your Own Customer Base
Look at the distribution your store actually has
Segment the curve before you change anything
Questions that lead to action
How to Lift AOV Without Sacrificing Conversion Rate
Build offers that increase order quality
Protect conversion while you test
Gain Influence Over Your App Stack
Your Starting Point AOV Calculation and Data Methodology
AOV starts with one formula
AOV is simple to calculate and easy to misuse.
Average order value = total revenue / number of orders. That gives you a clean number for the dashboard. It does not give you a decision by itself. On Shopify, that number can move because pricing changed, bundle uptake improved, shipping thresholds nudged baskets higher, or a few large orders temporarily pulled up the mean.
The first job is to make the calculation boring and consistent. Use the same revenue definition every time. Decide whether you are looking at gross sales or net sales. Keep refunded orders, draft orders, wholesale orders, employee orders, and subscription rebills in or out on purpose, not by accident. If the denominator changes month to month, the trend is noise.
That matters more than any benchmark screenshot.
Teams that want tighter operator comparisons can also target research participants by product sales and average order value when they need feedback from brands that resemble their own scale.
What this guide uses and what it ignores
External benchmark data has a role. It helps frame the range of what exists in ecommerce. It does not tell a Shopify operator what to change on Monday.
Use AOV as a diagnostic metric, not a trophy metric. A store with a high reported AOV can still have weak merchandising if a small slice of oversized orders is doing the work. A store with a lower AOV can be in better shape if most customers cluster just below a free shipping threshold or bundle breakpoint. That is a much easier problem to solve.
So the starting point is not, “How do we compare to the category average?” The better question is, “What does our order value distribution look like, and which customer or product segments are driving it?”
That shift changes the work. It moves the team away from vanity comparisons and toward a measurement method that can support pricing tests, bundle strategy, threshold offers, and retention analysis without muddying the read.
Ecommerce AOV Benchmarks by Category
External category benchmarks get too much attention.
They can stop a bad conversation. They rarely start a useful one.
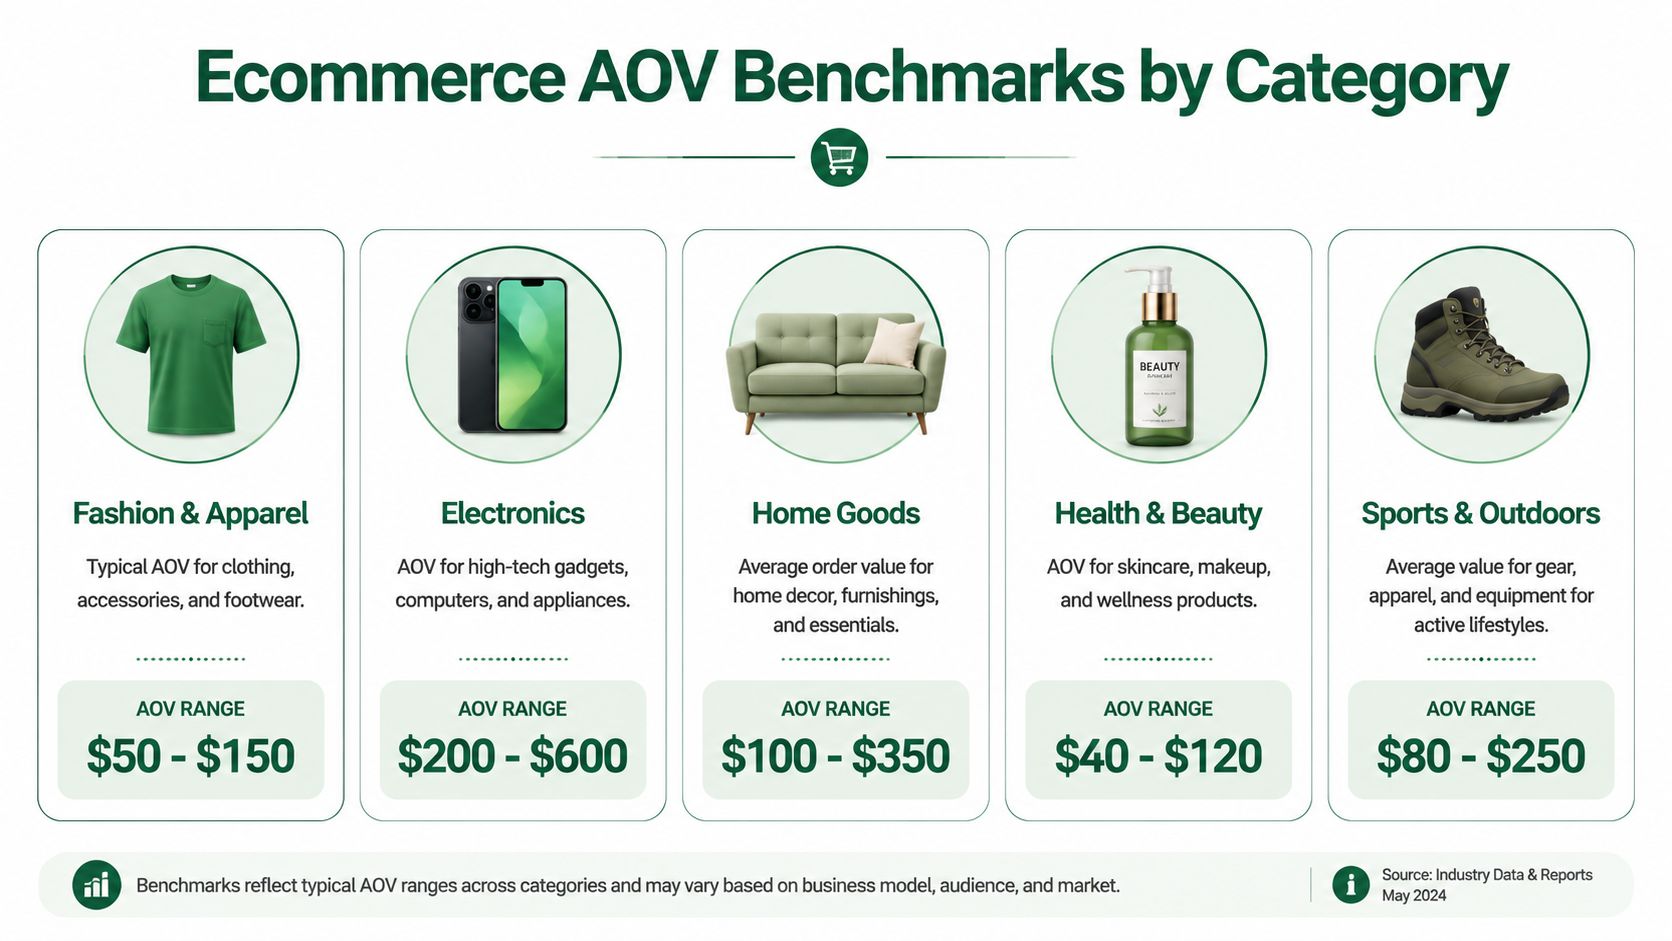
Analysts at Dynamic Yield show a wide spread across categories. Luxury & Jewelry comes in at $313, while Pet Care sits at $67. That range matters because it exposes how weak the question “what's a good AOV?” really is without product context.
The gap is easy to explain. Luxury and jewelry stores can support higher price points, slower purchase cycles, and fewer items per order. Pet care often runs on replenishment behavior, lower ticket items, and repeat demand. Both models can produce healthy unit economics. They just produce very different baskets.
A quick benchmark table
Category lens | Benchmark signal | What it usually means |
|---|---|---|
Luxury & Jewelry | $313 | Higher price points, lower purchase frequency, larger order values |
Pet Care | $67 | Replenishment behavior, lower-ticket items, more frequent orders |
Broad ecommerce category view | Varies widely | Catalog mix, pricing structure, and repurchase patterns drive the range |
That table is useful for one purpose. It helps confirm whether your store is operating in the rough neighborhood of comparable products.
It does not tell you what to fix.
I would use category benchmarks as a sanity check only. If a brand sells low-ticket consumables, a lower AOV is often structurally normal. If a store sells premium bundles or considered-purchase products, a higher AOV may say more about the catalog than about merchandising quality. The same reported AOV can come from very different realities. One store may have healthy second-item attachment across the customer base. Another may be relying on a small share of oversized orders.
Category benchmarks help with orientation. They are weak scorecards for operators.
The practical read is simple. Use category data to avoid obviously bad comparisons, then move back to your own order distribution, segments, and margin profile. That is where AOV becomes a metric you can improve, instead of a number you defend in a screenshot.
How AOV Changes by Store GMV Stage
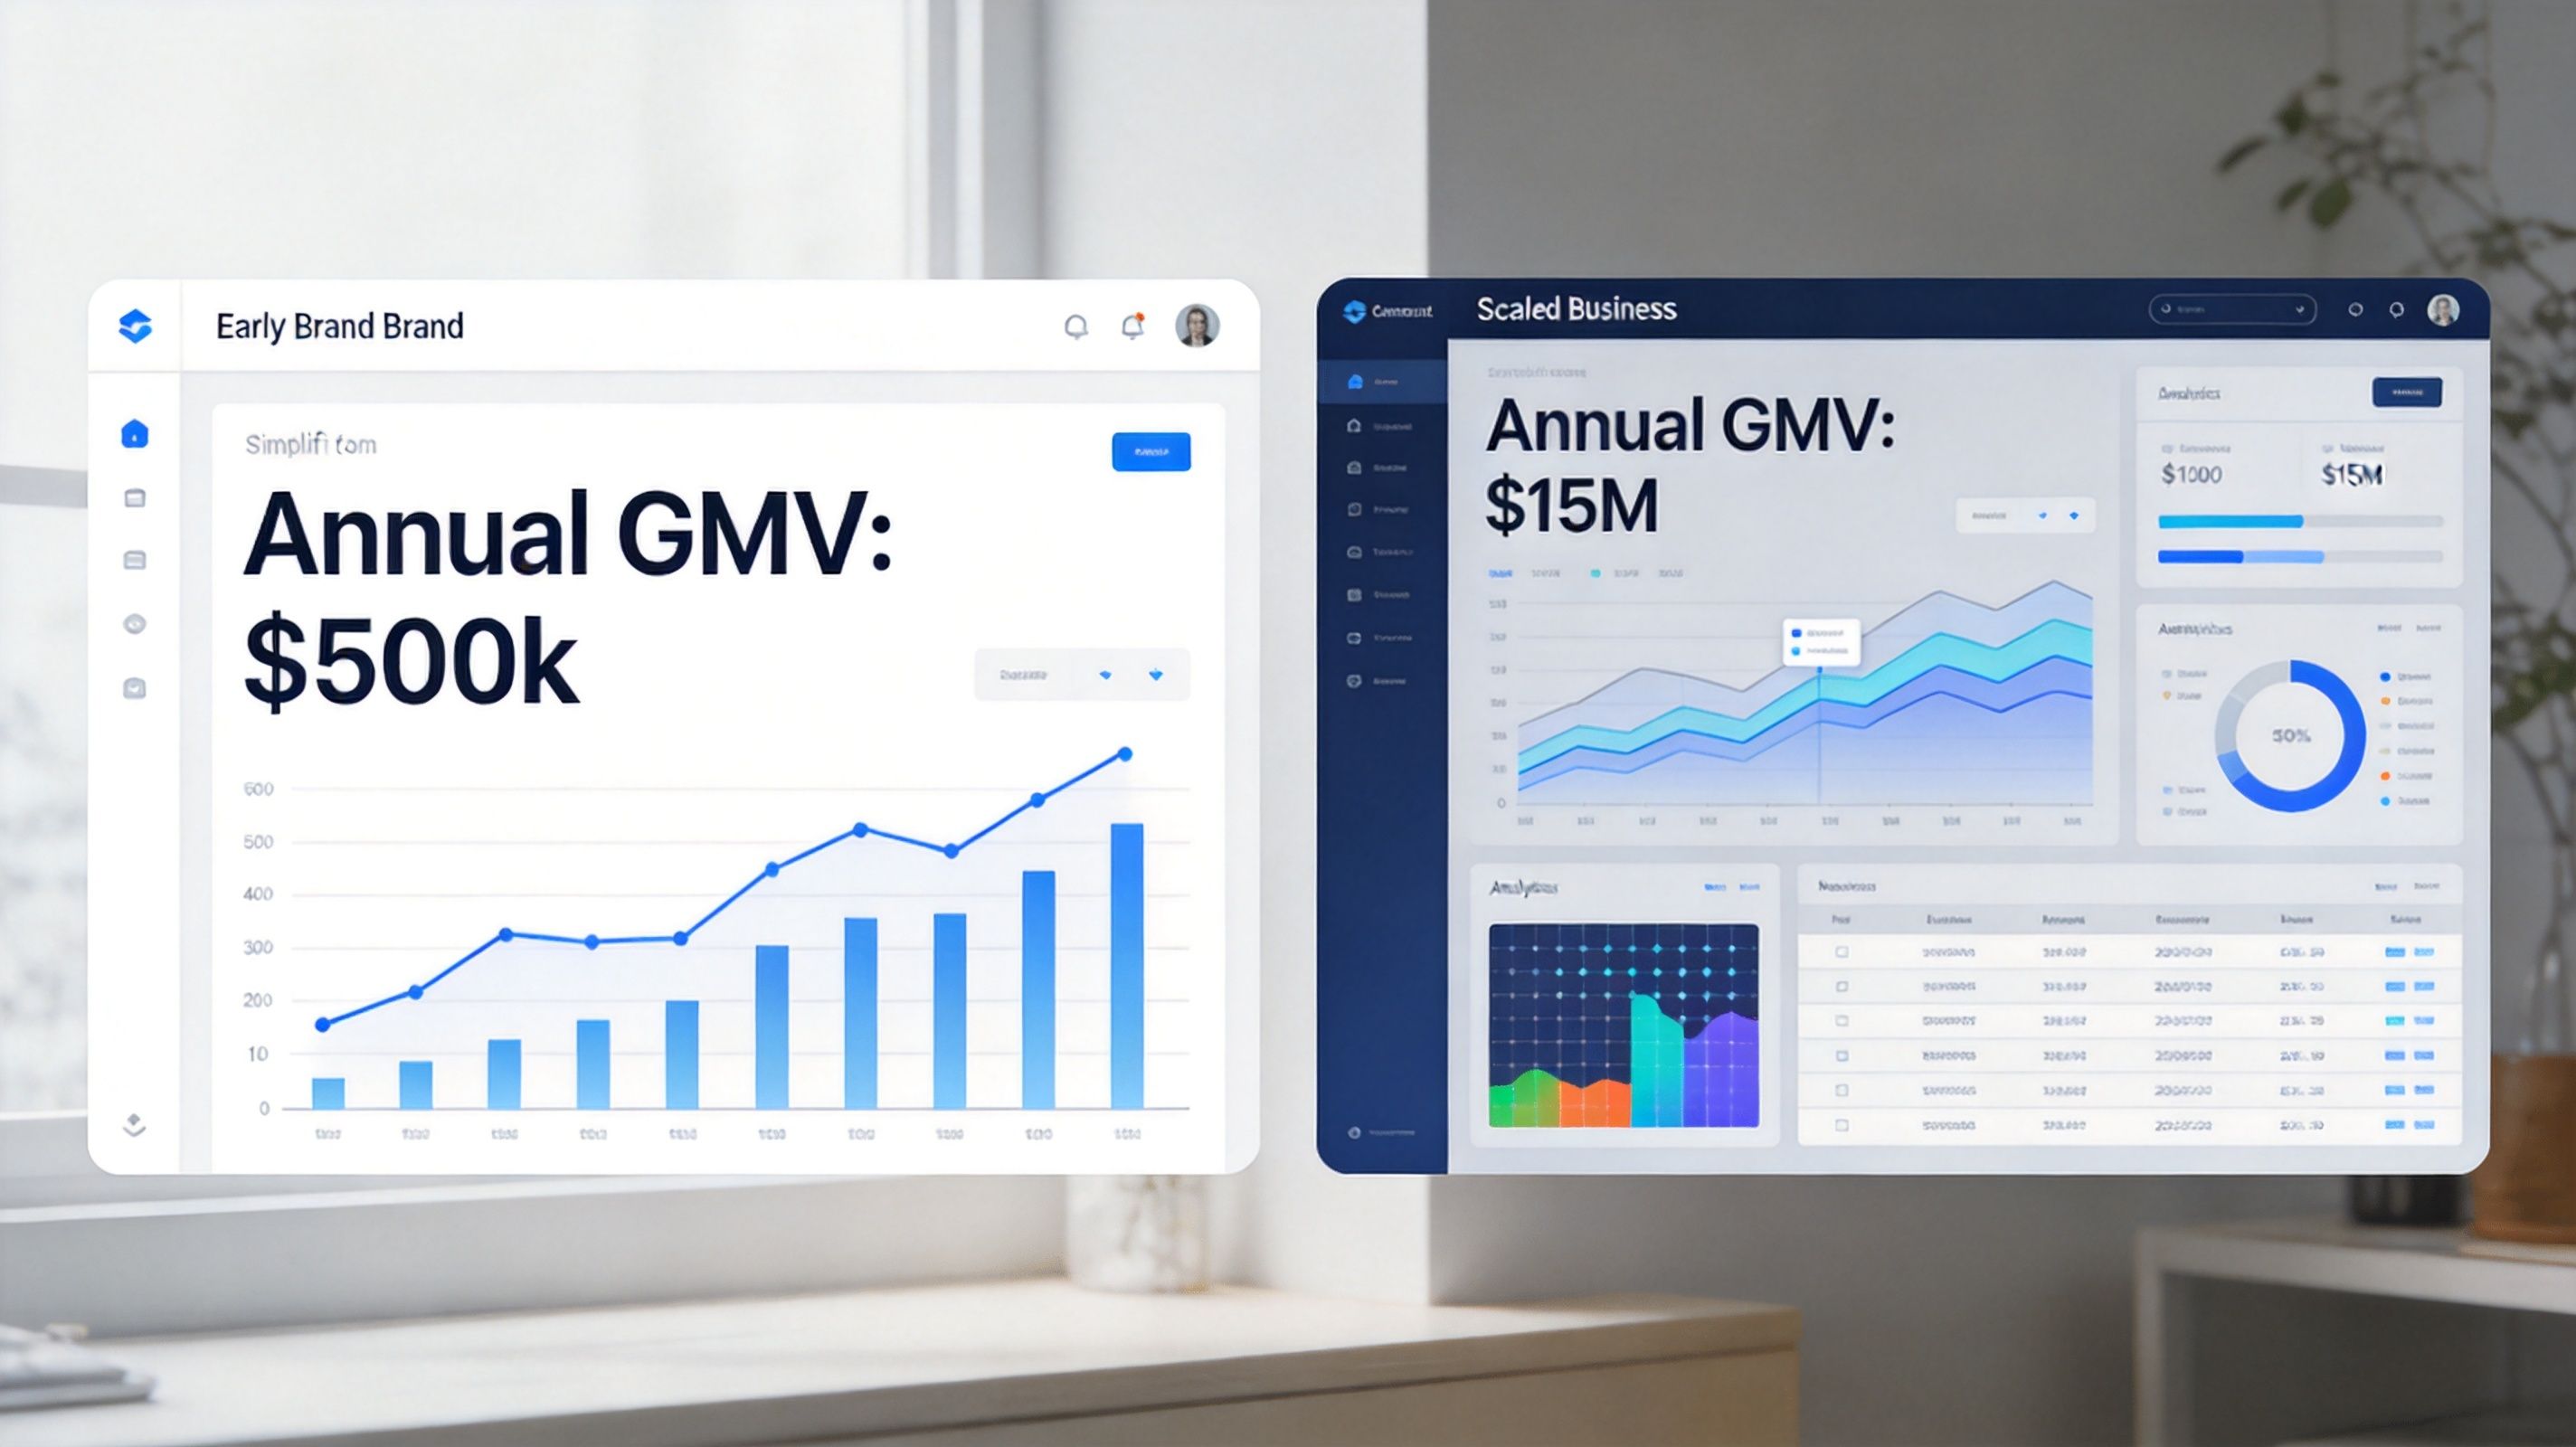
Scale changes what AOV is supposed to do.
At lower GMV, AOV is usually a byproduct of a young catalog, a narrow pricing ladder, and a customer making a first commitment. At higher GMV, AOV starts acting like an efficiency metric because paid acquisition, fulfillment, and merchandising complexity all carry more weight. Using the same target across both stages creates bad decisions.
A $500k brand should not manage AOV like a $15M brand. Early teams usually need proof that a hero SKU converts, that traffic quality is acceptable, and that first-time buyers come back. For that operator, a lower AOV can be perfectly rational if the first order is designed to reduce friction. I would rather see a clean path into the catalog and strong reorder behavior than a forced bundle that lifts basket size and cuts conversion.
The practical question at this stage is not, "How do we raise the average?" It is, "Which order patterns show real demand?"
That shifts the analysis. Look at first-order mix, item count per order, attachment rate by hero product, and whether certain entry products lead to bigger second or third orders. Those patterns tell you whether AOV has room to grow naturally through merchandising, or whether the store is trying to manufacture a larger basket before product-market fit is stable.
At mid-scale, the conversation gets more operational. The store has enough volume to compare AOV by channel, campaign, device, landing page, new versus returning customer, and discount exposure. Broad averages start to hide profitable pockets at this stage. One paid social campaign may drive lower AOV but healthy margin after repeat purchase. Another may post a nice front-end AOV and still underperform because discounting or shipping cost wipes out the gain.
By the time a brand is scaled, AOV is tied directly to contribution margin. Small changes matter because they apply across a much larger order base. Teams usually get more from tightening bundle logic, setting smarter thresholds, improving cart and checkout visibility, and treating mobile and desktop behavior as different merchandising environments. Larger brands also have enough order volume to see whether high AOV is broad-based or concentrated in a thin slice of customers.
That distinction matters more than the stage average itself. A store can report a healthy AOV at $15M GMV and still have a weak basket-building system if a small group of heavy buyers carries the number.
A simple way to frame AOV by stage is below.
GMV stage | Main AOV question | Common operator focus |
|---|---|---|
Earlier-stage brand | Which entry orders create repeatable demand and lead to stronger follow-up orders? | Hero SKU entry points, first-order item mix, starter bundles, repeat purchase path |
Mid-scale brand | Which segments produce larger orders without giving up margin or conversion rate? | Channel and customer segmentation, threshold testing, discount control, cart and PDP offers |
Scaled brand | Where can the business raise order value across a large volume base without relying on a small set of outlier orders? | Personalized merchandising, bundle depth, device-specific UX, contribution margin by segment |
Why Category Benchmarks Mislead and What to Use Instead
Averages hide the operating model
AOV benchmarks mislead because they compress different businesses into one number.
A subscription-heavy CPG brand, a one-product gadget brand, and a broad-catalog apparel store can all report similar AOVs while running completely different economics. One may rely on repeat frequency. Another may need a large first basket to make acquisition pay back. Another may use bundles to offset rising fulfillment costs.
That's why category numbers are often vanity metrics in practice. They tempt teams to chase a benchmark rather than fix the part of the order experience that's broken.
A better benchmark hierarchy
A more useful hierarchy looks like this:
Business model first
Compare the store to brands with a similar catalog structure, replenishment cycle, and pricing model.Growth stage second
AOV expectations should reflect whether the brand is proving demand or optimizing for efficiency.Internal percentiles third This is the level that drives decisions.
Existing content also tends to skip another practical issue. Shopify apps can directly boost AOV by 20% to 30% through upsells and bundling, but operators still need to validate which tools fit their own AOV problem, as noted in Envive's AOV gap analysis. That's where category benchmarking breaks down. Two brands in the same category can need completely different app logic. One needs cart bundling. Another needs post-purchase offers. Another just needs a cleaner product page.
The wrong benchmark creates the wrong roadmap.
A store that chases a higher average without checking margin, conversion rate, and customer type can end up with cosmetic improvement. The number rises. The business doesn't.
Analyzing AOV Distribution Within Your Own Customer Base
Look at the distribution your store actually has
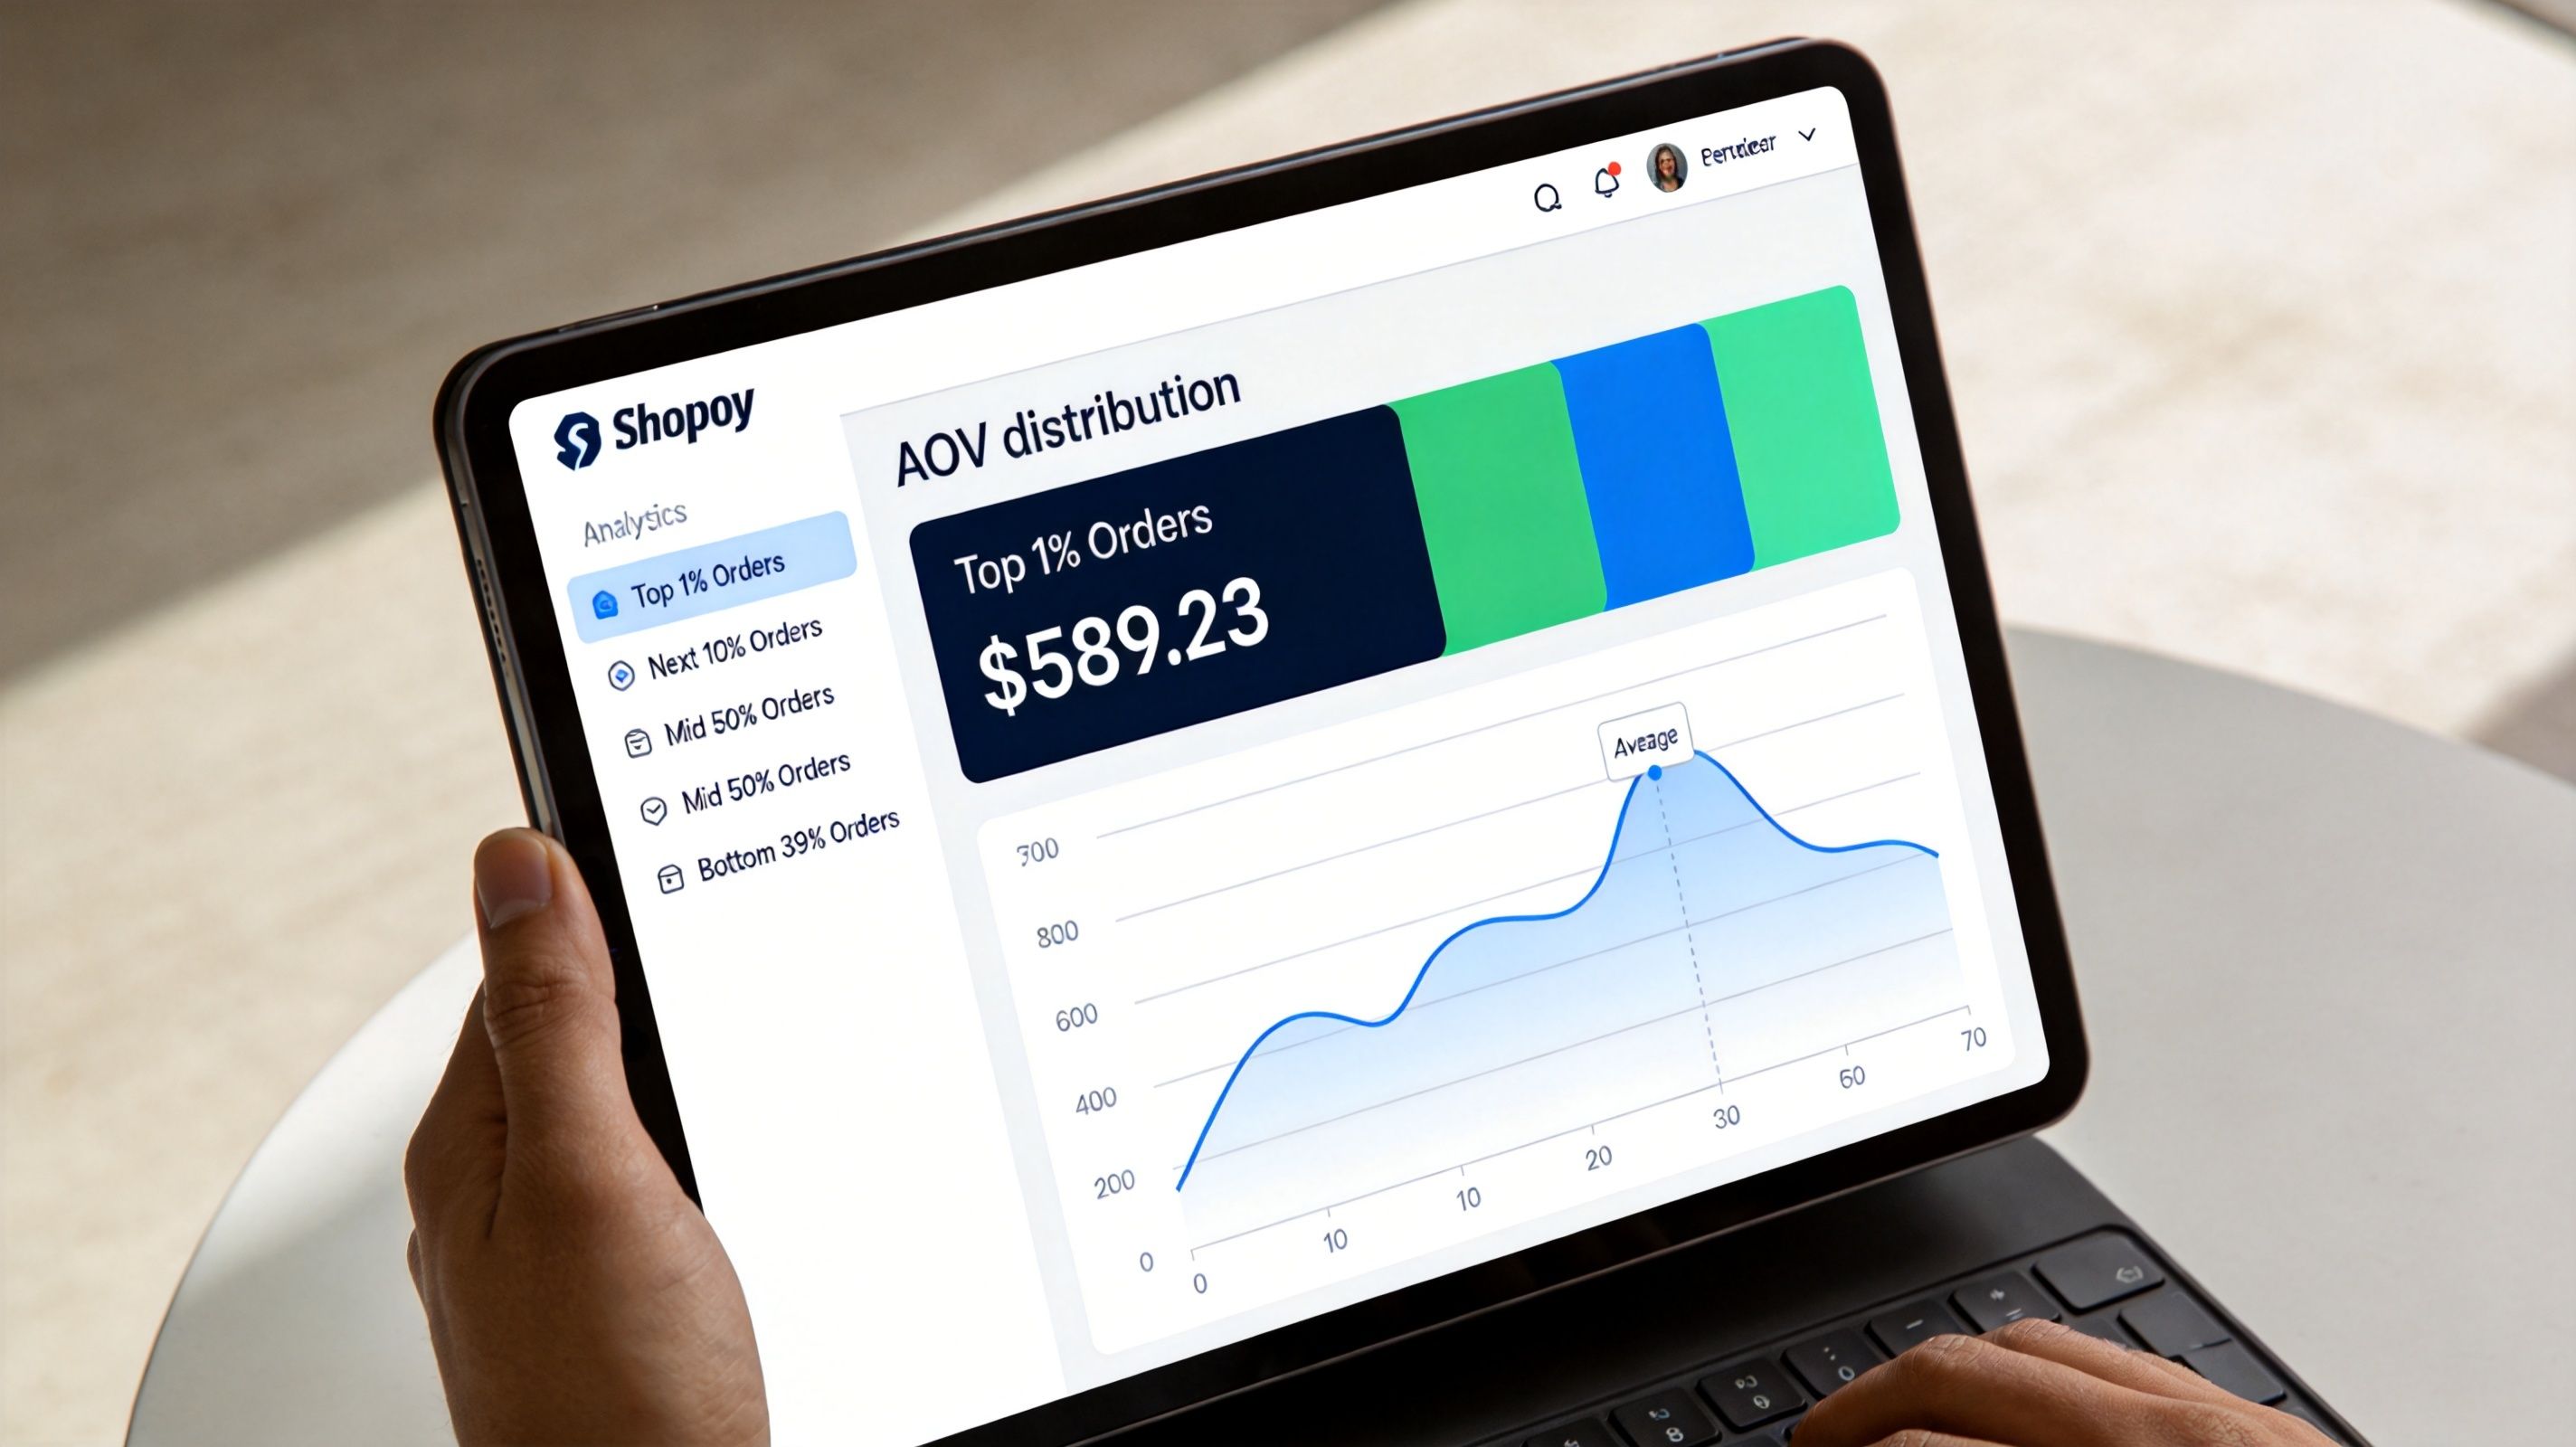
AOV gets useful once you stop treating it like a single score.
The store average can stay flat while order quality shifts underneath it. A small group of large baskets often carries more revenue than teams realize, especially on Shopify stores with giftable products, replenishment SKUs, or bundle-friendly catalogs. If those orders soften, the business can feel weaker before the headline AOV number shows the problem.
Start with the spread inside your own order file. Compare mean order value to median order value. Then isolate the right tail. Which orders sit well above your normal basket size, what products they include, what channel brought them in, and whether they come from first-time or repeat customers. That analysis gives you a practical benchmark. External category averages do not.
The goal is not a higher average. The goal is understanding which order patterns create profitable basket expansion.
Segment the curve before you change anything
Use simple bands first. Complexity can come later.
Segment | What to inspect | What it often reveals |
|---|---|---|
Top-value orders | Product mix, bundle usage, discount depth | Which combinations create unusually strong baskets |
Middle-band orders | First product added, cart composition, exit point | Where average shoppers stop short of a larger order |
First-time customers | Entry SKU, landing page, offer taken | Whether acquisition is bringing in basket builders or one-item buyers |
Returning customers | Repeat purchase gap, add-on behavior, category expansion | Whether the catalog supports larger follow-up orders |
Channel cohorts | Paid social, email, organic search, direct | Which traffic sources drive stronger basket quality, not just cheaper CAC |
In practice, I like to start with three cuts. Orders below median, orders around median, and orders in the far-right tail. From there, break each group by product category, discount usage, device, channel, and customer status.
That usually surfaces the underlying issue fast.
A store may find that high-AOV orders come from email, not paid social. Another may see that bundles raise basket size only for returning customers. Another may learn that mobile shoppers add the first item easily but rarely discover the second item because the merchandising block sits too low on the page.
Questions that lead to action
These are the questions that tend to produce changes worth shipping:
Which SKUs show up repeatedly in larger baskets?
Those are your basket-building products. Feature them earlier in the journey.Where does the second item get added?
Product page, cart drawer, bundle widget, or post-purchase offer. The location matters because it points to the merchandising layer doing the work.Which customer segments resist basket growth?
New customers from paid acquisition often need a different offer structure than returning customers from email.Which high-AOV orders are low quality? Large discounted baskets can look good on paper and still hurt contribution margin.
What happens after app exposure?
If an upsell app gets impressions but rarely changes item count, the issue is placement, offer quality, or tool fit. Reviewing new Shopify apps for merchandising and upsell workflows can help operators compare approaches before adding more clutter to the stack.
Teams that answer those questions usually stop chasing a vanity benchmark and start finding the actual constraint. Sometimes it is price architecture. Sometimes it is assortment logic. Often it is a weak attachment path, where the obvious add-on is available but poorly surfaced. Tactics like complementary item suggestions for Shopify shoppers work best after that diagnosis, not before.
The pattern matters more than the average. Once you know who builds bigger baskets and how they do it, AOV work becomes a store-specific operating system instead of a benchmark chase.
How to Lift AOV Without Sacrificing Conversion Rate

The fastest way to hurt conversion is to chase a higher basket total in the abstract.
AOV goes up safely when the offer improves the order the customer already intended to place. More utility. Less effort. Better fit. If the shopper feels pushed into adding something they did not come for, conversion rate usually pays for it.
That trade-off matters on Shopify because many stores install upsell tools before they define the job of the offer. The app is not the strategy. The strategy is deciding whether the customer needs a better starter bundle, a useful add-on, or a reason to cross a threshold with one more item.
Build offers that increase order quality
The cleanest AOV gains come from offers that make the purchase more complete.
Bundles that match buying intent
Bundles work when the products solve one buying job together. Skincare routines, camera starter kits, and bedding sets are obvious examples. The customer does not have to decode why the products belong together.
Fixed bundles work best when certainty matters and choice adds friction. Mix-and-match bundles work better when preference matters, like size, shade, or scent. If a team is comparing tools to support those flows, a scan of newer Shopify merchandising and upsell apps is a useful starting point before adding another widget to the stack.
Cross-sells with a clear reason to exist
Generic recommendation blocks rarely do much for AOV. Context does.
The add-on should answer a simple question: what is the next sensible item for someone buying this product right now? That usually means protection, refill, accessory, or completion. Cart Whisper's guide to complementary item suggestions for Shopify shoppers is a practical reference for placing those offers where they support the purchase instead of interrupting it.
Thresholds that change behavior without giving away margin
Free shipping and gift thresholds can work well, but only if the gap is believable. A threshold that sits a few dollars above the current median cart often gets claimed with no real basket expansion. A threshold set too far away gets ignored.
Set the target where one sensible add-on gets the shopper there. Then check contribution margin, not just top-line lift.
Protect conversion while you test
AOV experiments fail when teams judge them on accepted offers alone. The primary question is whether total revenue per session improves without introducing enough friction to drag down checkout starts or completed orders.
Use a tighter testing sequence:
Start with PDP and cart placements
These placements usually outperform more aggressive interruptions because they support an active buying decision.Test one mechanic at a time
Bundle logic, cart add-ons, and threshold messaging should not be bundled into the same test. You need to know what caused the lift or the drop.Split mobile from desktop analysis
Mobile has less space and less patience. A module that works on desktop can bury the main CTA on a phone.Track margin and return behavior
Bigger carts are not automatically better carts. Heavy discounting, low-attach add-ons, and return-prone items can make a higher AOV less profitable.Watch time to checkout
If the offer adds decision load, the session often gets longer before conversion gets worse.
One more operator lesson. High-performing AOV work usually looks boring from the outside. It is rarely a flashy funnel hack. It is a better threshold, a more credible bundle, a cleaner cart add-on, or a recommendation placed where the customer already has intent.
Better AOV tactics improve the order the shopper wanted to place in the first place.
Gain Influence Over Your App Stack
The app stack behind AOV growth changes fast. Upsell tools, bundling apps, merchandising layers, and analytics products all promise similar outcomes, but the fundamental difference usually shows up in workflow fit, not marketing copy.
That's why strong operators don't just browse listings. They pressure-test tools, compare notes with peers, and look at how teams think. A market view like the PeerPush listing for Scryer AI Analyst can be useful for staying current on emerging products, but serious evaluation still comes down to direct operator judgment. A structured framework also helps, especially one built around implementation reality, data ownership, and support quality, like this guide on how to evaluate Shopify apps.
For operators who want to gain an advantage, app store research is worth treating as a strategic channel, not a side activity. It connects Shopify merchants with paid product research interviews with app developers and UX teams. The value is direct access to founders and product teams, influence over roadmaps, and early visibility into what's being built.
The strongest operators don't wait for the app ecosystem to guess what they need. They get in the room. Join the network at app store research to take paid calls with the founders and product teams building Shopify tools, shape the features that affect revenue, and get more control over the software stack the business relies on every day.

Author
Jonathan Kennedy
Jonathan Kennedy is the founder of app store research and shopexperts, platforms that connect operators, founders, and experts across the Shopify ecosystem to drive better decisions, product development, and growth.


