The Best Shopify Analytics Apps for Operators in 2026
/
The search for the best Shopify analytics apps usually starts after the same moment. Revenue is moving, ad spend is moving, repeat purchase rate feels different, and Shopify's native reports aren't answering the critical question. Why did performance change, and what should the team do next?
Shopify's own analytics already cover the basics well. The platform gives merchants dashboards for recent activity, visitor behavior, web performance, and transactions, and Shopify says those reports help identify best-converting landing pages and merchandising tactics, including which products are often bought together in the same order, as explained in Shopify Analytics and reports. But that baseline is exactly why third-party tools exist. Operators usually need more than store reporting. They need attribution, cohort visibility, profit context, and cleaner answers across channels. For a broader framing of how ecommerce teams approach measurement, this e-commerce analytics guide is a useful companion.
What Shopify Analytics actually misses
Monday morning usually looks the same. Revenue in Shopify looks healthy. Meta says one thing, Google says another, Klaviyo shows strong email revenue, and finance still cannot match contribution by channel without a spreadsheet cleanup. The problem is not a lack of reports. The problem is that the answers live in different systems and use different logic.
Shopify's native analytics work well for store performance inside Shopify. They show sales, products, sessions, conversion trends, and basic customer data. That covers a lot for early-stage teams. It breaks down once a deeper question crosses functions, such as which acquisition source drives profitable repeat customers, or why conversion held steady while cash efficiency got worse.
The missing layer is decision support
Operators usually outgrow native reporting for one of four reasons. They need attribution they can defend in budget meetings. They need cohort analysis for retention and LTV work. They need a unified BI view that combines marketing, store, and finance data. Or they need inventory analysis tied to customer behavior, not just sell-through.
That is the lens for this guide. “Best Shopify analytics apps” is too broad to be useful on its own. The better question is which analytics gap is slowing decisions today.
Practical rule: Buy the tool that answers the recurring question your team cannot settle with Shopify alone.
A brand spending heavily on paid social has a different reporting problem than a retention-led brand with strong repeat purchase volume. A merchandising team trying to prevent stockouts has a different problem again. Grouping tools by that missing layer is more useful than comparing feature checklists.
Where native reporting is still enough
Native Shopify reporting is often enough when the business is still relatively simple. A small catalog, limited channel mix, and straightforward reporting cadence do not always justify another analytics bill. If the team mainly needs sales by product, channel-level trends, and a baseline read on store conversion, Shopify can cover that. It also helps to benchmark performance against broader ecommerce conversion rate benchmarks before assuming the reporting tool is the issue.
The upgrade usually becomes justified when one of these gaps starts costing time or confidence:
Cross-channel consistency: marketing, retention, and finance need the same revenue and efficiency view
Customer depth: the team needs cohorts, LTV, repurchase timing, or lifecycle analysis
Actionability: insights need to feed campaigns, forecasts, or planning instead of sitting in a dashboard
Shopify's own developer documentation shows how much of the modern stack now depends on pixels, segments, and app integrations, as outlined in Shopify marketing analytics developer documentation. In practice, that means the limiting factor is rarely access to more charts. It is whether the tool fits the operating question your team needs to answer every week.
Triple Whale strongest for blended attribution
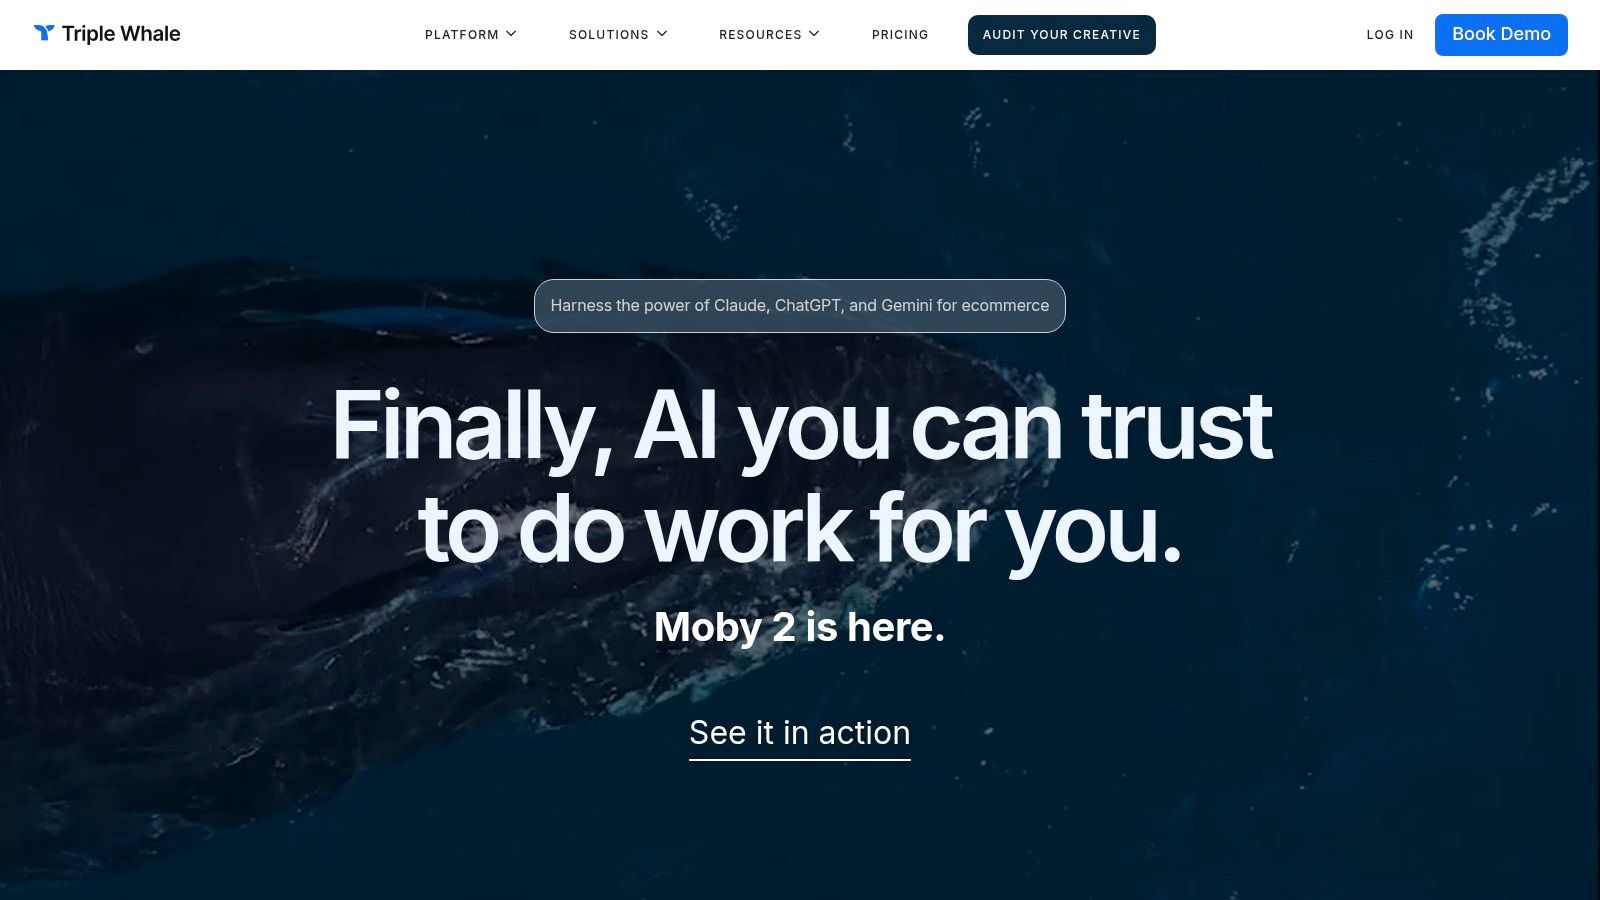
Triple Whale tends to make sense when paid media drives the business and the team is tired of reconciling Meta, Google, Shopify, and email performance by hand. It is built around the question growth teams ask all day. Which spend is working, what creative is pulling weight, and where can budget scale without flying blind.
Where Triple Whale fits
The appeal is simple. It puts attribution and media analysis at the center rather than treating them as a side module. For brands that already think in terms of blended acquisition efficiency, that's the right orientation.
This is also why Triple Whale alternatives come up so often. The comparison usually isn't about whether the product is capable. It's about whether the store needs an attribution-first operating system or something broader. A useful evaluation lens is this guide on how to evaluate Shopify apps.
Teams that live in ads usually want one screen for spend, revenue, survey signals, and creative feedback. Teams that don't, usually find attribution tools heavier than they need.
What works and what does not
What works:
Best for paid-media-led brands: It suits operators making daily budget calls.
Strong merchant fit: It's a familiar option in DTC stacks and often sits close to media buyers.
Useful when speed matters: It can reduce the spreadsheet stitching that slows campaign decisions.
What does not:
Not the best fit for finance-led teams: If the main question is margin by SKU or operational reporting, there are better choices.
Can feel heavy for small teams: Stores with modest complexity may not use enough of the platform to justify it.
Doesn't replace BI for every use case: Ad-hoc deep analysis often still pushes teams elsewhere.
Tresl Segments strongest for customer cohort analytics
When the problem is retention rather than acquisition, attribution tools often become the wrong lens. A CRM or lifecycle team usually doesn't need another dashboard full of media views. It needs a clean way to understand customer groups, behavior shifts, and who should be activated next.
That's where Tresl Segments is stronger. It is better thought of as a customer intelligence and segmentation layer than a general reporting app.
Why lifecycle teams choose it
Its value shows up when a brand wants to answer questions like which first-time buyers are likely to come back, which product paths produce stronger repeat behavior, and which audiences should sync into email or paid channels. That is a different operating motion from attribution.
The strongest signal around Tresl is not novelty. It is practical activation. The Tresl customer research page gives a useful look at how Shopify operators evaluate the product in real buying contexts. For retention-focused teams, that kind of operator feedback is often more useful than another polished feature page.
The trade off
Tresl is not a finance tool. It's not where a team should go for detailed profit reporting, accounting-style outputs, or broad BI modeling. It also won't solve the “which ad channel deserves credit” argument.
What it does well is narrower and more valuable for the right team:
Cohorts that can be acted on: Useful for lifecycle marketing, not just reporting.
Segment sync: Better when insights need to move into Klaviyo, Meta, Google, or Shopify workflows.
Customer-centric analysis: Stronger than general dashboards for retention decisions.
For operators trying to raise conversion quality, repeat rate, and average order value over time, segmentation often matters more than one more top-line ROAS view.
Polar Analytics strongest for unified BI
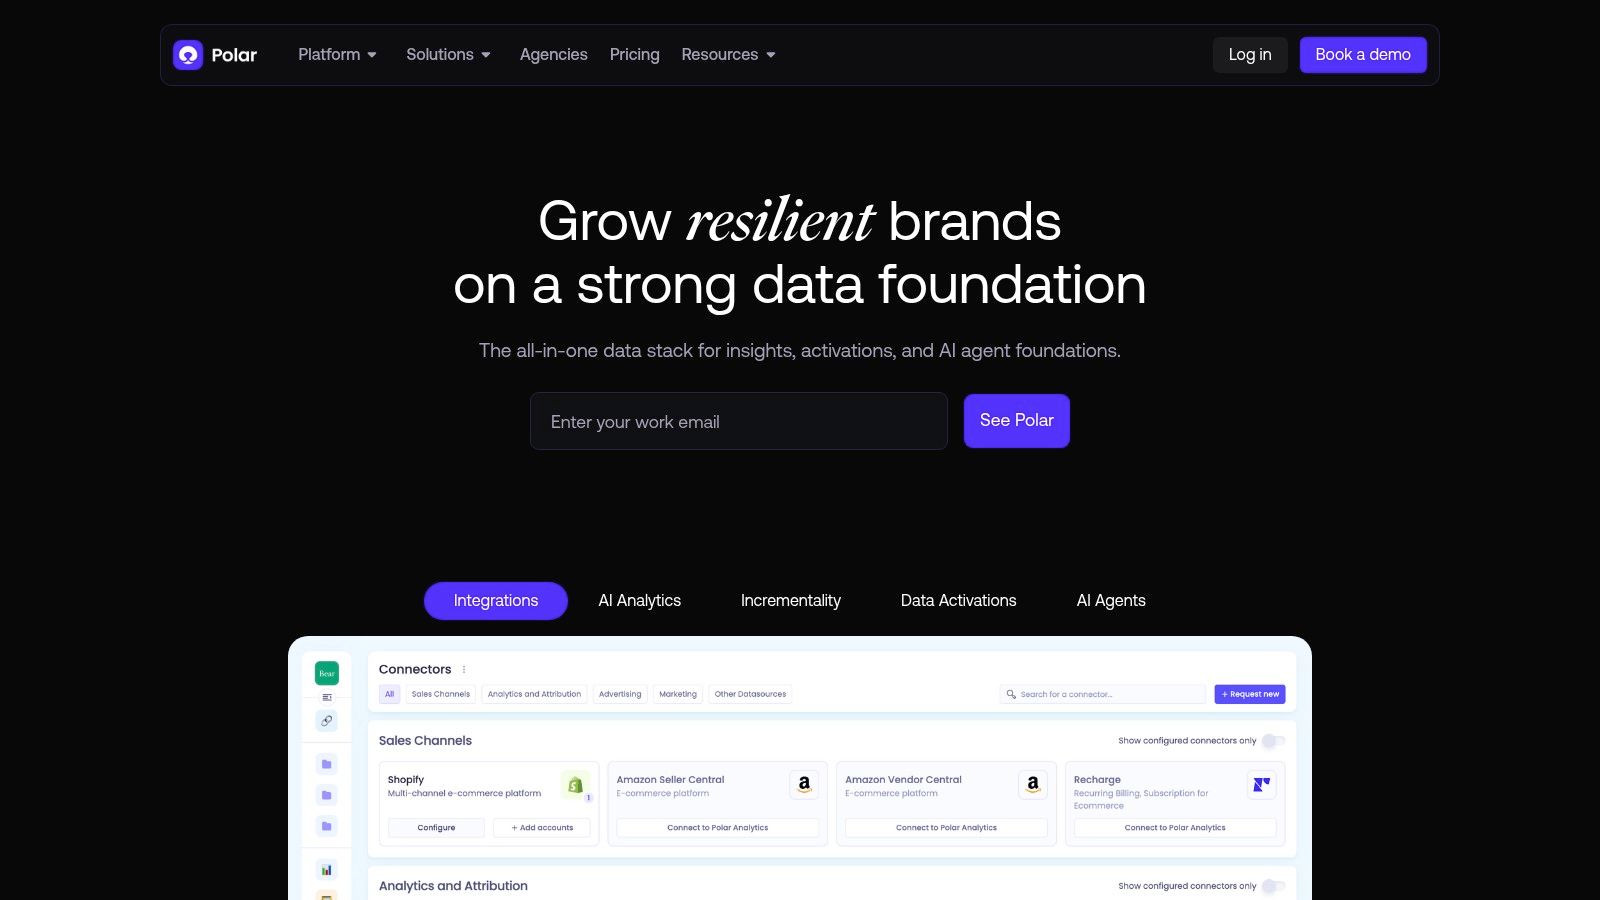
Polar Analytics fits teams that have already outgrown Shopify-native reporting and point tools. The job here is not another dashboard. The job is to put marketing, store, and finance data into one operating view that the whole team can use without rebuilding the same report every week.
That positioning is clear in the Polar Analytics Shopify App Store listing, which describes a platform that centralizes 45+ data sources and reports on profit and loss, ad spend, blended CAC, ROAS, MER, LTV, and cohorts in one place.
Best fit
Polar makes the most sense for brands with real reporting complexity. Multiple ad channels, a larger catalog, more than one market, or a team where acquisition, merchandising, and finance all need different cuts of the same data. In that setup, spreadsheet-based reporting starts to fail for a simple reason. Every department ends up maintaining its own version of the truth.
The price point matters too. Polar's App Store listing shows GMV-based pricing starting at $750 per month. That will screen out a lot of smaller stores, and that is useful. If a brand is still making decisions from a handful of core Shopify and ad-platform reports, a full BI layer is often too early.
Why operators buy a unified BI layer
Unified BI earns its budget when reporting friction starts slowing decisions. A growth lead wants blended performance by channel. Finance wants margin context and cleaner profit reporting. Leadership wants one answer to basic questions like new customer acquisition cost or contribution by product line.
Polar is built for that cross-functional use case. That is the core distinction in this guide's framework. Triple Whale is stronger when the main gap is attribution. Tresl Segments is stronger when the main gap is retention and cohort actionability. Polar is the better fit when the gap is shared visibility across the business.
One practical benefit stands out. Teams spend less time reconciling numbers across Shopify, Meta, Google, and spreadsheets, and more time deciding what to change.
The trade off
A unified BI platform adds overhead. Someone still has to define metrics, check mappings, and make sure the team is reading the same KPI the same way. Buying Polar does not automatically fix bad data hygiene or fuzzy ownership.
It is also more tool than many brands need. If the business has a small team, limited paid spend, and straightforward reporting questions, lighter tools usually deliver faster payback.
Polar is strongest when these conditions are already true:
Several data sources need to be combined: Store, ad, and finance views have to line up.
Multiple teams rely on the same reporting layer: Marketing, operations, and leadership need shared numbers.
Manual reporting has become a recurring tax: Weekly exports and spreadsheet cleanup are eating time.
Used in the right context, Polar helps replace reporting sprawl with one BI layer the business can run on.
Glew strongest for inventory plus customer combined
Glew fits a narrower but important use case. Some brands don't need another attribution layer. They need inventory and customer analytics to talk to each other.
That sounds less flashy than media measurement, but it's often where profit is won or lost. Overstocking the wrong products, under-ordering repeat drivers, or missing customer patterns behind category performance creates expensive mistakes that a pure attribution tool will never catch.
Where it earns its place
Glew tends to appeal to operators who think in terms of merchandising, planning, and customer value at the same time. The point isn't only to know which product sold. It's to connect who buys, how often they return, and what inventory decisions follow from that.
This category matters because the Shopify app market increasingly rewards tools tied closely to revenue operations. App adoption patterns show merchants install customer-data, messaging, and review tools at very large scale. Klaviyo is installed on over 397,950 stores, Shopify Inbox on over 367,042 stores, and Judge.me on over 542,330 stores, according to Shopify app store statistics from Craftberry. That matters for inventory-aware analytics because customer and operational data already live across multiple systems.
What to watch
Glew isn't the obvious first purchase for a smaller store. If the business still has a simple catalog and one main sales channel, it may be too much tool for the current stage.
It makes more sense when:
Merchandising has become analytical: Replenishment and assortment decisions need data support.
Customer and stock data need to connect: Teams want to know not just what moved, but who drove demand.
The business is operationally complex: Planning errors are now expensive enough to justify another system.
Free vs paid when to upgrade
The jump from free to paid usually happens too early or too late. Some stores buy a premium analytics stack before they have enough complexity to benefit from it. Others stay inside basic reporting long after the business has outgrown it.
The right question is not whether paid analytics is “better.” It is whether the team is losing time, trust, or decision quality because the current setup can't answer the next operational question.
What free tools can handle
Free or entry-tier tools still have a role. The current market includes options such as Google Analytics, Heap, BeProfit, Report Pundit, and Mipler alongside more expensive products like Triple Whale, Polar Analytics, Lifetimely, and Metorik, as noted in the same MIDA roundup summarized through the Shopify analytics category landscape. That spread exists because not every store needs a premium stack.
A free or low-cost setup is often enough when the team mainly needs traffic trends, order reporting, and straightforward channel review. If one person can still explain the numbers without opening six tabs, the store may not need to upgrade.
What paid tools are really buying
Paid analytics earns its place when it buys one of three things:
Cleaner attribution: For media-heavy brands.
Deeper retention views: For lifecycle and CRM teams.
Unified business context: For finance, growth, and ops working together.
The mistake is paying for complexity without internal users. If no one owns the dashboard, no one trusts the definitions, and no one changes decisions because of it, the subscription is just another line item.
Picking by use case
Pick the tool based on the question your team keeps failing to answer on Monday morning.
A founder wants to know which channel is driving new customer revenue. The retention lead wants to see which first-order cohorts come back and why. Finance wants one set of numbers for sales, ad spend, returns, and margin. Those are different analytics gaps, and they usually require different tools.
For attribution problems
Triple Whale is the strongest fit when paid media is a major growth driver and the team needs a clearer read on blended performance. It is built for operators who review channel efficiency constantly and need fast answers without pulling reports from multiple platforms.
Polar can cover attribution too, but that choice usually comes with a broader BI commitment. It makes more sense when attribution is only one part of the reporting problem.
Littledata belongs in this category for a different reason. Sometimes the issue is not the dashboard. It is weak event tracking, inconsistent purchase data, or poor signal quality flowing into GA4 and ad platforms. In those cases, cleaning the data path produces more value than adding another reporting layer.
For retention problems
Tresl Segments is the better choice when the team needs cohort analysis tied to action. It helps lifecycle and CRM teams move from reporting to segmentation, campaign decisions, and repeat-purchase work.
Lifetimely fits stores that want a simpler view of customer value, profit, and LTV trends without taking on a full BI setup. It is often the more practical option for lean teams that still want better retention visibility.
A simple way to choose:
Choose Tresl when segment activation and cohort behavior drive decisions
Choose Lifetimely when customer value and profit need to be reviewed together
Choose faster, narrower retention tools when the goal is reporting speed, not stack depth
For reporting and finance problems
Polar is the strongest option when the business needs unified BI across marketing, store performance, and finance. It is a better fit for teams that already know they need shared definitions across departments, not just better channel reporting.
Report Pundit and Data Export IO make more sense when the problem is custom Shopify reports, scheduled exports, or operational reporting for specific teams. They are narrower tools, but often the right ones.
BeProfit sits between those categories. It gives operators better profit visibility than native Shopify reporting, without the heavier lift that comes with a full BI platform.
This is usually where buying mistakes happen. Teams shop by feature checklist, then end up with a tool built for analysts when the actual user is a media buyer, retention manager, or ops lead. The better approach is to match the app to the decision owner first, then judge how much breadth the business needs.
Setup pitfalls
Most analytics disappointments come from setup mistakes, not bad software. Teams buy the right category of tool, then wire it up around the wrong definitions or expectations.
That is why analytics migrations feel worse than they should. The dashboard is live, but the old questions still aren't answered cleanly.
Common mistakes
Buying for status instead of need: The team chooses the platform everyone talks about, not the one that fits the workflow.
Skipping metric definitions: Marketing, finance, and leadership all use the same words for different numbers.
Treating implementation as a one-time task: Ownership disappears after install.
Expecting one tool to do everything: Attribution, BI, retention, and operational reporting are not always one product.
A dashboard doesn't fix a measurement model. It only exposes whether the business has one.
A better rollout approach
A stronger rollout usually starts with three questions. Which decisions need to improve first. Which team will use the tool weekly. Which source of truth must win when numbers conflict.
Then the team maps the stack around that reality. Shopify's own reporting remains the store-level baseline. The third-party tool fills the gap, rather than trying to replace every workflow on day one.
For teams evaluating analytics vendors, this also creates a useful side benefit. Direct conversations with product teams often lead to better implementation guidance, roadmap visibility, and sharper feedback loops than a standard sales cycle.
Top 10 Shopify Analytics Apps Comparison
A comparison table only helps if each row points to a real analytics gap. These tools are not interchangeable. Some answer attribution questions, some explain retention, some give finance a cleaner reporting layer, and some help operators connect inventory to customer behavior.
Use the table that way. Start with the question your team cannot answer reliably today, then match the app to that job.
App | Core focus | Best for / Target audience | UX & strengths | Price notes | Why try via AppStoreResearch |
|---|---|---|---|---|---|
Triple Whale | Multi-touch attribution, Triple Pixel, post-purchase surveys, creative AI | Paid-media-led DTC brands scaling ads | Deep Shopify integration, strong creative reporting, useful blended view when platform numbers conflict | Scales with GMV. Usually makes more sense once ad spend is material | Book paid calls with app devs, get incentives, early access, and direct input into feature priorities. |
Polar Analytics | Owned data plus Snowflake warehouse, first-party pixel, AI agents | Multi-store and omnichannel brands that want a central reporting layer | Unlimited users, semantic layer, strong cross-team reporting, good fit for brands outgrowing spreadsheet BI | Sales-led, GMV-based pricing | Discover newer vendors, meet product teams, and pressure-test implementation before a larger rollout. |
Peel Insights | Retention, cohorts, subscription analytics, daily insights | Subscription brands and retention-focused teams | Fast time to value, clear cohort reporting, practical daily insights for operators watching repeat behavior and conversion rate benchmarks | Not a warehouse replacement. Best used for retention questions, not broad BI | Talk to founders in structured calls to get early access, discounts, or consulting. Influence product with feature requests. |
Lifetimely (AMP) | Predictive LTV, daily P&L, cohort and product performance | Brands prioritizing profit, margins, forecasting, and average order value | Profit-first dashboards, approachable UI, easy for founders and operators to use without a BI team | Scales by order volume, not GMV tiers | Join calls to validate use cases, reduce app cost impact, and sometimes access founder advice or deals. |
BeProfit - Profit Analytics | Live P&L, real-time profit, UTM attribution, multi-store | Operators and finance teams needing immediate profit visibility | Quick setup, multi-store reporting, clear margin views for day-to-day decision-making | Order caps on lower tiers | Use AppStoreResearch to find profit tools faster, give feedback, and get access to offers or incentives. |
Littledata - The Data Layer | Server-side and first-party tracking into GA4 and ad platforms | Teams relying on GA4 and ad platforms that need cleaner conversion tracking | Trusted checkout capture, strong integrations with Meta, Google, and TikTok, useful when attribution issues start upstream | Flexible per-order pricing | Schedule calls to discuss tracking fixes with developers and qualify migration help. |
Segments by Tresl | AI-generated customer segments, RFM, FilterGPT, audience sync | CRM and lifecycle marketing teams driving LTV growth | Fast segment creation and activation into Klaviyo and ad channels. Strong fit when the gap is actionability, not dashboarding | Pricing rises with record sync volume | Meet founders and power users to learn activation tactics, shape segment features, and earn incentives. |
Report Pundit - Custom Reports | Advanced custom report builder, large Shopify field coverage | Finance, tax, inventory, and reporting teams | Very flexible report builder, good export options, strong value for teams that know exactly which reports they need | Affordable across Shopify plan tiers | Connect with app teams through paid sessions to request templates, get setup help, and access offers. |
Data Export IO: Reports | Scheduled exports, CSV/XLS/PDF, FTP and Sheets delivery | Ops and finance teams needing recurring automated reports | Dependable exports, broad prebuilt library, low-friction setup for recurring workflows | Low entry price, scales reasonably | Book calls to streamline export workflows, request custom outputs, and receive incentives. |
Daasity | Omnichannel analytics and data activation with a large connector library | Consumer brands with DTC plus wholesale or retail channels | Good for brands trying to unify merchandising, inventory, and channel performance in one system | Sales-led, heavier implementation | Use AppStoreResearch to vet integrations, meet vendor teams, and influence roadmap decisions while earning paid incentives. |
The practical split is simple. Triple Whale covers attribution. Tresl covers cohorts and activation. Polar covers unified BI. Glew often enters the shortlist when inventory and customer analytics need to live in the same view, even though other tools in this table may be stronger in a narrower lane.
That is the trade-off across this category. The sharper the specialization, the faster the tool usually answers one class of question. The broader the platform, the more setup discipline the team needs to get clean reporting.
Worth knowing if your numbers don't match: WeltPixel Conversion Tracking isn't an analytics app. It's the layer that gets conversion data to one. It sends purchase and funnel events to GA4, Meta, TikTok, Google Ads, Klaviyo and four other platforms, using both browser and server-side delivery. That way, orders still register when a pixel is blocked or the customer never reaches the thank-you page. Flat $39/month, unlimited orders.
Final Thoughts
The best Shopify analytics apps are not competing to do the same job. That's the main point serious operators need to keep in view. Shopify already covers core store analytics. The next layer depends on what's missing.
If the business is paid-media heavy and attribution drives day-to-day decisions, Triple Whale is usually the sharpest fit. If lifecycle marketing and retention are the bigger lever, Tresl Segments is a stronger choice. If the company needs a unified data layer across growth, merchandising, and finance, Polar Analytics stands out. If inventory planning and customer behavior need to be viewed together, Glew earns attention that many comparison lists skip.
The category itself confirms that this isn't a one-size-fits-all market. Shopify's app ecosystem now treats analytics as a broad category, and that expansion has created real specialization. Some tools focus on behavior analytics. Others on profit. Others on server-side tracking, custom reporting, or BI. The right stack is the one that matches the team's actual operating model.
That also means some stores should not upgrade yet. If Shopify's native reporting still answers the important questions, the smartest move may be to keep the stack simple. More software won't create clarity by itself.
The better approach is narrower. Name the missing answer. Pick the tool that solves that gap. Define ownership before implementation. Then judge the tool by whether it changes real decisions around spend, retention, merchandising, or margin.
That discipline is what separates useful analytics from expensive reporting.
The teams building the Shopify tools in this article need direct operator feedback, not more shallow form fills. App store research is a platform that connects Shopify merchants with paid product research interviews with app developers and UX teams. For brand operators and agency leaders, the value is access, influence over product roadmaps, and direct conversations with founders building the tools used every day. The incentive matters, but it's secondary. For the right operators, join the network to get paid to speak directly with app teams while gaining earlier visibility into what's being built next.

Author
Jonathan Kennedy
Jonathan Kennedy is the founder of app store research and shopexperts, platforms that connect operators, founders, and experts across the Shopify ecosystem to drive better decisions, product development, and growth.