
Returns aren't a support metric. They're a margin metric.
That point gets missed because most benchmark roundups lead with a single average and stop there. But for a Shopify operator, ecommerce return rate benchmarks only matter if they help answer harder questions: which categories are dragging contribution margin, which SKUs create avoidable reverse-logistics cost, and when a more generous return policy helps conversion enough to justify the hit.
The macro picture is clear. The average ecommerce return rate for 2025 is around 19.3%, while brick-and-mortar retail sits around 8.89%, according to industry reporting summarized here. Online, roughly one in five orders comes back. That alone makes returns a planning issue for inventory, cash flow, and paid acquisition.
Table of Contents
How to Read Return Rate Benchmarks
Orders, items, and dollars aren't interchangeable
Which denominator fits the decision
Return Rate Benchmarks by Category
The blended average hides the operating reality
A practical benchmark table by category
The Full Cost of a Return Not Just the Refund
The refund is only the visible line item
A simple operator framework
Levers That Reduce Returns
Merchandising fixes expectation gaps first
Site UX and fulfillment close the remaining gap
Returns Infrastructure
What dedicated returns tools actually change
What to look for before adding another app
When to Embrace Returns as a Feature
Some categories need trust more than friction
How Top Operators Influence the App Ecosystem
How to Read Return Rate Benchmarks
A return rate benchmark is only useful if the store is measuring the same thing.
That's where many teams go wrong. One dashboard tracks returned orders. Another tracks returned units. Finance looks at refunded revenue. Then everyone debates whether the store's return rate is “good” or “bad” even though they're looking at different denominators. A Shopify-focused guide makes this problem explicit: benchmarking by orders, items, or refunded dollars can produce very different conclusions, especially when a few high-AOV products drive outsized refund value or when bracketing inflates item returns within a single order, as discussed in this Shopify return benchmarking guide.
Orders, items, and dollars aren't interchangeable
Order-based return rate is useful when the question is customer behavior. It answers, “How often does a purchase event lead to a return at all?”
Item-based return rate is better for diagnosing assortment problems. It surfaces whether a specific SKU, size run, or category creates disproportionate friction.
Dollar-based return rate is what finance should care about when margin pressure is the issue. A store can look stable on orders returned while still leaking profit if the returned products are the expensive ones.
Practical rule: use the metric that matches the decision. Don't use a single storewide percentage for everything.
Which denominator fits the decision
A simple way to keep this clean:
Business question | Best metric | Why it matters |
|---|---|---|
Is customer purchase confidence improving? | Order-based return rate | Shows how often transactions turn into returns |
Which SKUs need fixing? | Item-based return rate | Exposes product-level and size-level issues |
Where is margin being lost? | Dollar-based return rate | Captures the financial weight of high-value returns |
This is the same discipline strong operators apply to conversion analysis. A blended store conversion rate can hide the specific problem if mobile, paid traffic, or a specific funnel step is doing the damage. The same logic applies to returns, which is why teams that already track segmented performance in areas like ecommerce conversion rate benchmarks usually build better returns reporting too.
Return Rate Benchmarks by Category
About 1 in 5 ecommerce purchases is expected to come back in 2025, versus 8.89% for brick-and-mortar retail, according to Stamped With Love's ecommerce return rate benchmark compilation. For operators, that gap matters because it sets the baseline for labor planning, reverse-logistics capacity, inventory recovery, and margin protection. A category benchmark is useful only if it helps answer a practical question: are returns running at a normal level for this business model, or is something in the offer creating avoidable cost?
The blended average hides the operating reality
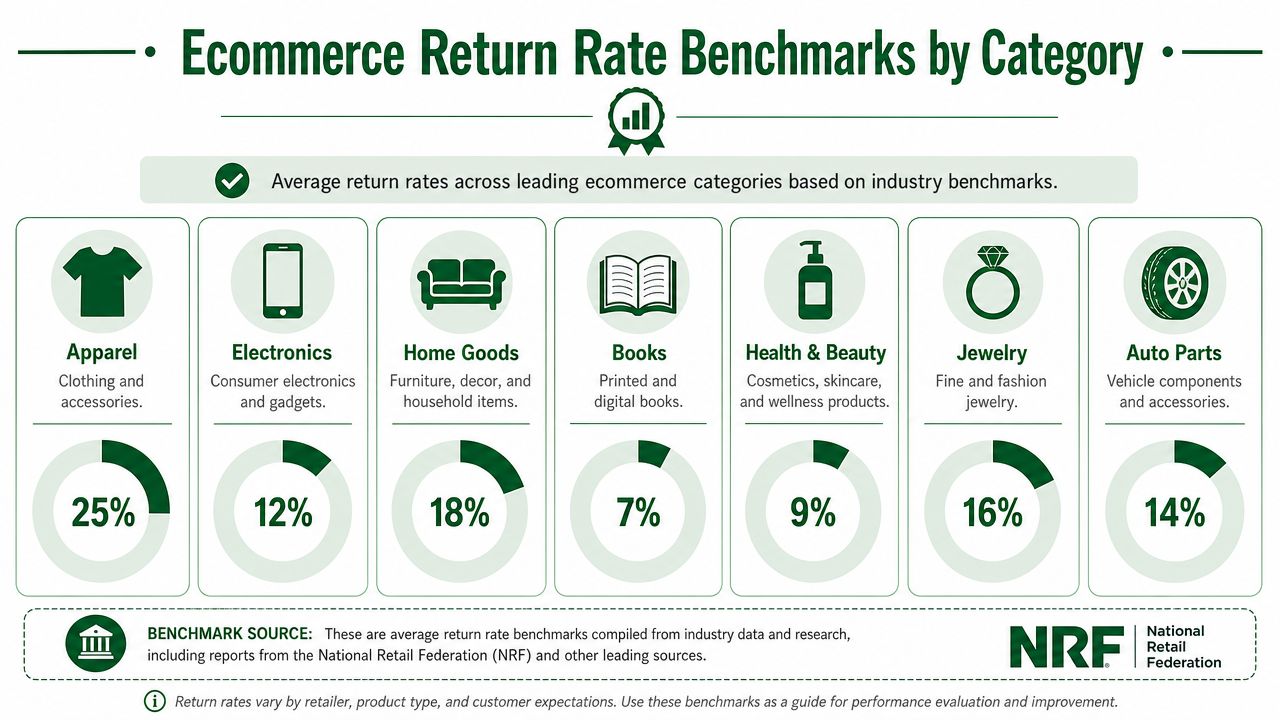
A storewide average is a weak management tool. Online apparel returns reached 24.4% in 2023 in the benchmark example above, while jewelry was about 4% and electronics around 15%. That spread is wide enough to make cross-category comparisons misleading.
This is why category benchmarks need context. Apparel often carries built-in fit risk and higher bracketing behavior. Electronics returns can be driven more by compatibility issues, buyer's remorse, or damage in transit. Jewelry usually benefits from simpler sizing and lower trial volume, but its economics can still be painful if inspection and resale standards are strict.
Benchmark against your category first. Then segment again by season, acquisition channel, and first-time versus repeat customers.
A practical benchmark table by category
Public benchmarks are directionally useful, not precise operating targets. The better use case is setting investigation thresholds. If a category typically sits near one band and your store is several points above it for multiple months, that usually points to a merchandising, expectation-setting, or policy problem worth fixing.
Category | Benchmark signal |
|---|---|
Apparel and fashion | Highest-return category in many public reports. Commonly above the ecommerce average because fit, color, fabric expectations, and bracketing all push returns up |
Electronics | Often lower than apparel but still meaningful. Returns are frequently tied to compatibility confusion, defects, or setup expectations |
Jewelry | Often much lower than apparel in public benchmark examples, but inspection standards and condition grading still affect recovery value |
CPG and low-touch replenishment categories | Usually lower-return categories when the product is standardized, repeat purchase behavior is established, and the customer knows what will arrive |
Furniture and fit-sensitive home goods | Return pressure rises fast when dimensions, materials, color, assembly effort, or room-fit expectations are unclear |
Benchmarks also move with the calendar. A separate retail benchmark summary from Red Stag Fulfillment's overview of ecommerce return rates notes that holiday returns can run well above the annual average, and that category ranges vary sharply. That is why operators should stop asking for a single "good" return rate. The useful question is narrower: what return rate is economically acceptable for this category, in this season, with this customer mix and margin profile?
That shift changes how teams use benchmarks. They stop treating returns as a customer service score and start using category norms to decide where to tighten product pages, where to review size curves, where to cap free-return generosity, and where a higher return rate is part of the model.
The Full Cost of a Return Not Just the Refund
Many teams still talk about returns as if the refund is the cost.
It isn't. The refund is just the most visible line item. The larger financial issue is everything attached to that return event. That matters because the National Retail Federation's 2025 projections estimate U.S. retail returns at $849.9 billion, equal to 15.8% of annual sales, based on this summary of NRF returns data. At that scale, a store doesn't need a catastrophic return rate to feel the damage. It only needs weak controls around the costs surrounding each return.
The refund is only the visible line item
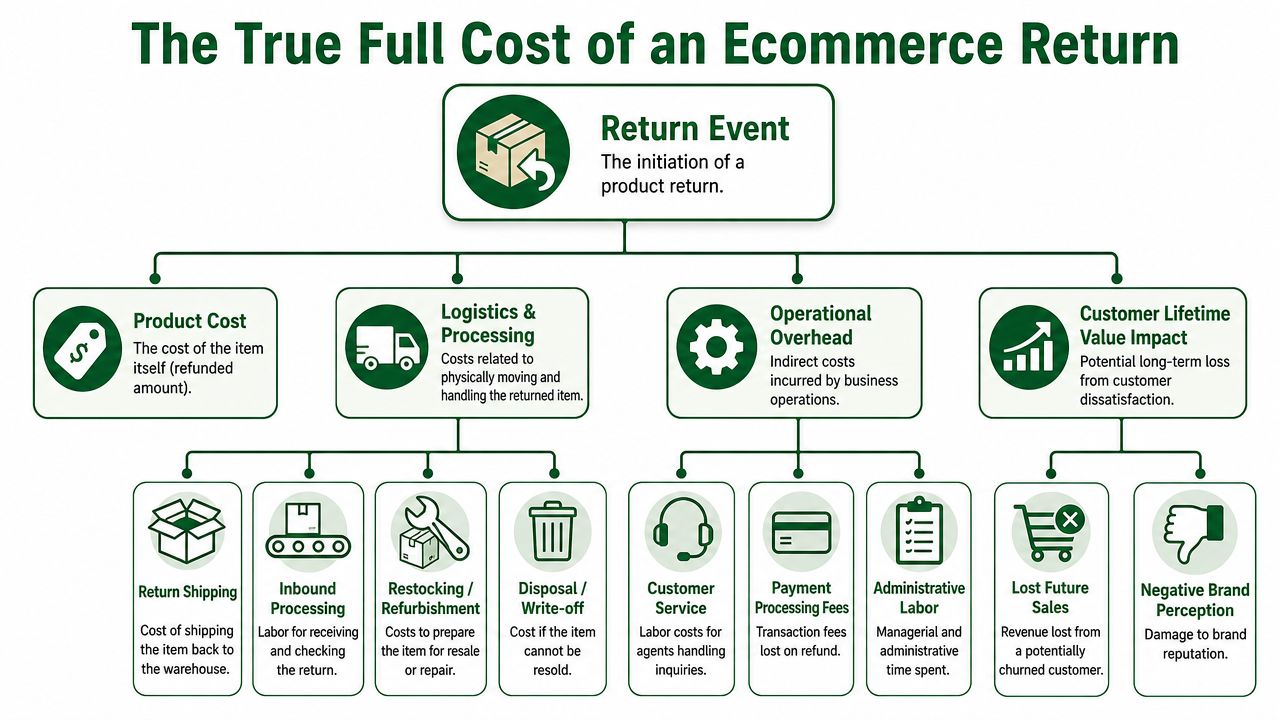
The operator view is broader than customer service and broader than accounting.
A single return can involve outbound shipping that was already spent, return shipping, receiving labor, inspection, restocking, support time, packaging waste, possible discounting if the item can't go back into prime inventory, and delayed inventory availability if the item sits in limbo. If the returned order came from paid acquisition, that customer acquisition spend often doesn't come back either.
The cleanest internal question is not “what did this customer get refunded?” It's “what did this return event cost the business after recovery?”
A simple operator framework
The most useful way to model this is by cost layer:
Cost layer | What to include |
|---|---|
Direct refund exposure | Refunded product revenue |
Reverse-logistics cost | Return label, carrier handling, receiving |
Warehouse handling | Inspection, grading, restocking, refurbishing, disposal |
Commerce overhead | Support tickets, refund admin, payment fee leakage |
Margin recovery impact | Markdown risk, delayed resale, unsellable units |
Demand-side impact | Wasted acquisition spend and lower inventory accuracy |
This is why storewide return rate alone isn't enough. A low-AOV consumable with occasional refunds behaves very differently from a high-ticket item that comes back opened, repackaged, and harder to resell.
For Shopify teams, the practical move is to calculate return cost at the category level first. That usually reveals where the pain sits much faster than a blended P&L view.
Levers That Reduce Returns
Most return reduction work has nothing to do with making returns harder.
The best levers reduce uncertainty before checkout and reduce errors after checkout. That sounds obvious, but many stores still spend more time tuning policy language than fixing the product page, image set, or size communication that caused the return in the first place.
Merchandising fixes expectation gaps first
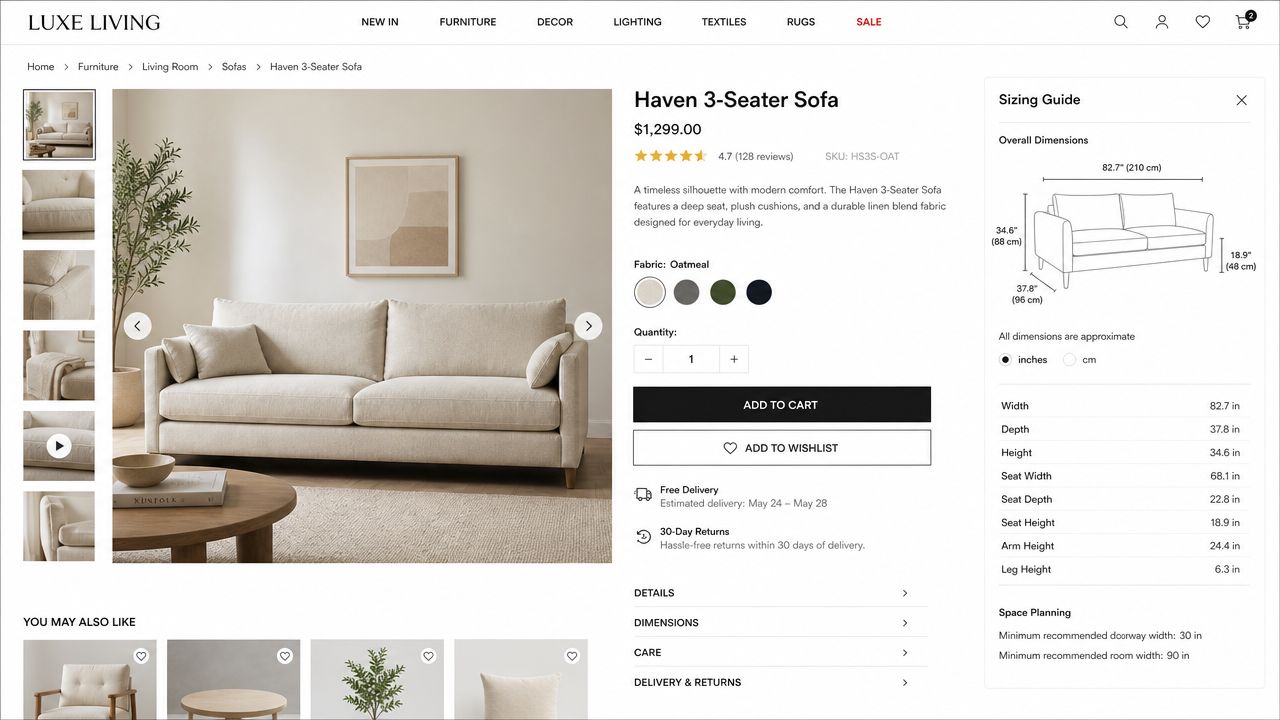
The strongest return-reduction lever is better expectation setting.
That usually starts with the product page. Detailed dimensions, fit notes, material descriptions, and photography that shows scale and texture do more work than another banner about hassle-free returns. In apparel, sizing language needs to be concrete. Broad claims like “true to size” rarely help when the underlying issue is variance across cuts, fabrics, and brand conventions. Resources that explain how to beat vanity sizing for good are useful because they show why shoppers lose trust in generic size labels and why measurement clarity matters.
Three fixes tend to matter most:
Sizing specificity: Include garment or product measurements, not just standard size labels.
Visual honesty: Show the item in context, from multiple angles, and in lighting that doesn't distort color.
Description depth: Clarify material feel, rigidity, stretch, finish, weight, and any setup or compatibility constraints.
Site UX and fulfillment close the remaining gap
After merchandising, the next layer is site UX.
Fit finders, compatibility selectors, variant guidance, and exchange-first return flows help because they reduce the risk of the wrong decision at the point of purchase. User-generated content can also help when it answers practical questions the brand copy didn't cover, such as whether a sofa reads darker in real homes or whether a dress runs short in a specific size range.
Fulfillment discipline matters more than many brands admit. A surprising share of returns don't start with taste or fit. They start with mis-picks, damaged packaging, missing parts, or the wrong variant shipped.
A return caused by bad merchandising is a content problem. A return caused by the wrong item in the box is an operations problem. Operators should separate those causes fast.
The stores that improve return rates without hurting conversion usually work in this order: product page truthfulness first, fit and selection support second, warehouse accuracy third. Policy changes come after that, not before.
Returns Infrastructure
Manual returns break down long before anyone expects them to.
Email threads, spreadsheet tracking, ad hoc labels, and support-managed exchanges might work for a small catalog. They don't work once return reasons need structured reporting, warehouse teams need consistent disposition rules, and finance needs reconciliation that doesn't depend on customer support notes.
What dedicated returns tools actually change
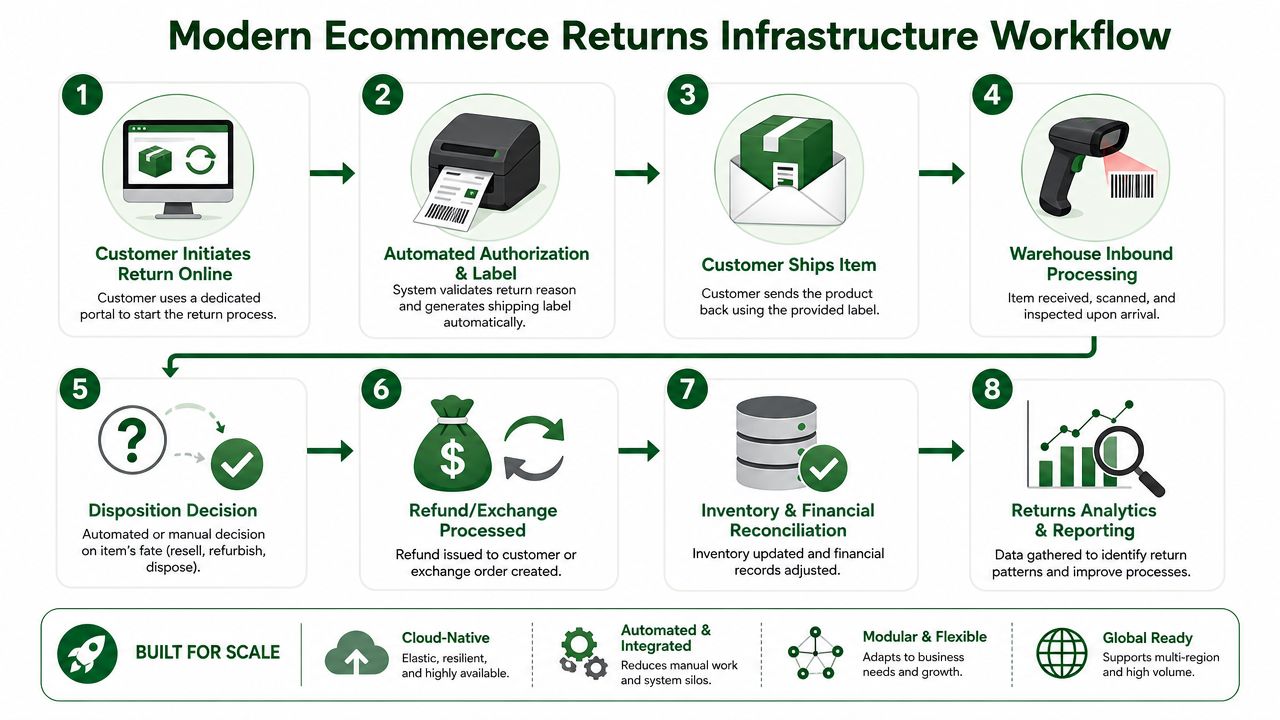
Platforms like Loop, AfterShip Returns, and Returnly exist because returns need their own workflow layer.
At a practical level, those tools usually do four jobs well. They standardize initiation through a self-serve portal. They automate eligibility rules and labels. They make exchanges easier to push than pure refunds. And they create cleaner data on reason codes, item condition, and processing status.
For operators reviewing the broader stack around shipping and post-purchase operations, the work behind ClickPost and shipping infrastructure research is relevant because it reflects the same operating reality. Returns aren't isolated from shipping. They sit inside the same fulfillment, carrier, and customer communication system.
What to look for before adding another app
A returns tool earns its place when it improves one or more of these:
Evaluation area | What good looks like |
|---|---|
Exchange workflow | Exchanges are easier for customers than refunds |
Policy logic | Rules are segmented by product, reason, or customer context |
Warehouse handoff | Inbound items are easy to inspect, classify, and restock |
Analytics quality | Reason codes are structured enough to drive merchandising action |
Stack fit | It doesn't create a second source of truth for ops and finance |
Before adding one more app, it helps to review whether the post-purchase stack already has overlapping functions. A basic Shopify app stack audit often exposes where returns, shipping notifications, helpdesk workflows, and WMS logic are duplicating each other.
When to Embrace Returns as a Feature
Not every high return rate is a failure.
In some categories, returns are part of the sale. Apparel, premium home goods, furniture, gifting, and other high-consideration products often need a credible return promise to get the first purchase over the line. In those cases, trying to suppress returns too aggressively can hurt conversion more than it helps margin.
Some categories need trust more than friction
The better question is whether returns are creating confidence or chaos.
A trust-building return policy works when the product has legitimate uncertainty before delivery. Fit, feel, scale, color, comfort, and in-home context are hard to resolve on a screen. If the category depends on trial, a smooth return path can function as risk removal.
That doesn't mean being careless. It means designing for the right trade-off. A brand may accept more returns if the policy helps first-time customers convert, increases exchange behavior, and supports a better long-term customer relationship. A brand in a replenishment category with low product ambiguity should think very differently.
Returns become a feature when they remove purchase hesitation in categories where hesitation is rational.
The strongest operators don't romanticize free returns, and they don't demonize them either. They decide where returns support growth and where returns signal avoidable failure.
How Top Operators Influence the App Ecosystem
The returns tools in a Shopify stack don't improve on their own. Product teams improve them when operators bring real workflow pain, edge cases, and buying constraints into the conversation.
That matters because the people closest to return friction usually aren't the founders of the apps handling it. They're the operators managing policy exceptions, warehouse bottlenecks, reason-code mess, and margin leakage every week. When those operators speak directly with app teams, roadmaps get sharper. Feature requests get grounded in actual trade-offs. Sales claims get pressure-tested against how brands really work.
That dynamic is why experienced merchants often build direct relationships with vendors instead of treating the App Store as a one-way channel. The case for that is laid out well in why 8-figure Shopify brands build direct relationships with app founders.
The best operators don't just buy software. They influence it.
Top Shopify operators often want more than another demo. They want direct access to the founders and product teams building the tools that shape margin, operations, and growth. app store research is a platform that connects Shopify merchants with paid product research interviews with app developers and UX teams. That gives operators influence, early visibility into what's being built, and a real chance to influence roadmaps. The incentive matters, but it's secondary. For many experienced teams, the bigger value is access. Those who want that kind of seat at the table can apply to participate in the network.

Author
Jonathan Kennedy
Jonathan Kennedy is the founder of app store research and shopexperts, platforms that connect operators, founders, and experts across the Shopify ecosystem to drive better decisions, product development, and growth.


